Market Review
- Despite the stress in the banking system, including the second-largest bank failure in U.S. history (Silicon Valley Bank), global equity markets held up remarkably well in March and posted solid returns for the quarter. The S&P 500 gained 7.5% in the quarter, while developed international stocks did a bit better, up 8.5%; emerging markets stocks lagged other equity markets, up 4.0% in the quarter.
- Underneath the calm market surface there was wide dispersion in returns across market caps and styles during the quarter. U.S. large cap stocks were up 7.5% compared to just 2.7% for small cap stocks. Breaking down U.S. large cap stocks into their growth and value components, the quarter saw the Russell 1000 Growth Index soar 14.4% while the Russell 1000 Value Index was only up 1.0%.
- Fixed income markets had a strong quarter as longer-term bond yields fell, generating price gains. Core investment-grade bonds (Bloomberg U.S. Aggregate Bond Index) returned 3.0%, as the 10-year Treasury yield fell to 3.5% from 3.9% at year-end. Riskier high-yield bonds (ICE BofA U.S. High Yield Index) slightly outperformed core bonds gaining 3.7%.
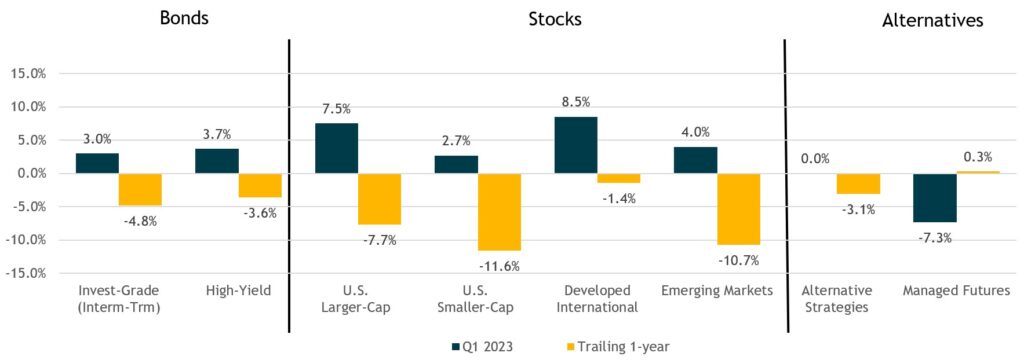
Performance reflects index returns as follows (left to right): Bloomberg US Aggregate, ICE BofA US High Yield, S&P 500, Russell 2000, MSCI EAFE, MSCI EM, Morningstar US Fund Multistrategy Index, SG Trend Index. Source: Morningstar Direct. Data as of 3/31/2023.
Silicon Valley Bank Was Susceptible to a “Bank Run”
- In a nutshell, SVB was a victim of a classic “bank run,” where depositors en masse seek to withdraw their money but the bank doesn’t have the “liquidity” (the cash on hand) to meet their demands.
- Importantly, SVB had unique characteristics that made it particularly susceptible to such a run, such as very high and concentrated exposure to uninsured deposits and very large unrealized losses from their bond holdings. This is one reason why we and most economists/analysts do not see this as the beginning of a replay of the Great Financial Crisis (GFC) of 2008.
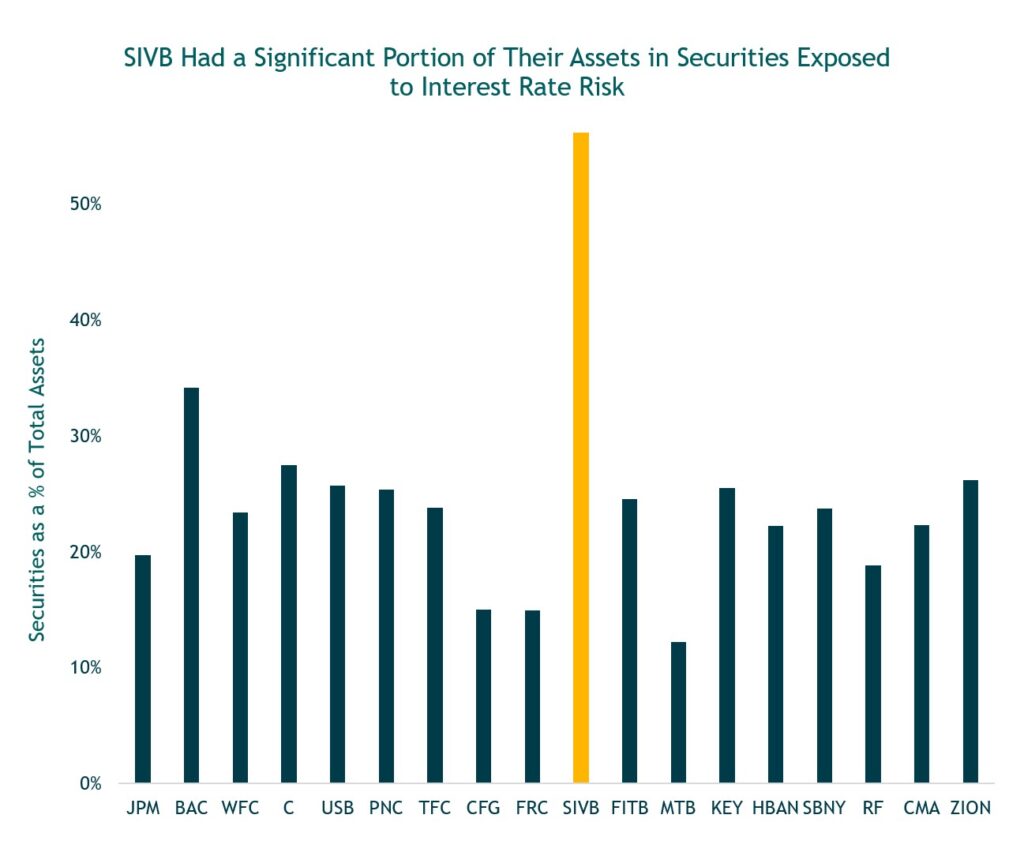
Source: FDIC. Data as of 12/31/2022
The Fed has Stemmed the Risk of a Broader Financial Crisis
- In response to the collapse of SVB, the Fed and FDIC set up a broad banking system liquidity backstop (the Bank Term Funding Program (BTFP)) and eased the Fed’s their regular “discount window” borrowing requirements for banks.
- The BTFP allows banks to borrow from the Fed for up to a year enabling banks to meet deposit withdrawal requests.
- While the banking system is not out of the woods and there may be smaller bank failures, it seems the Fed and FDIC have stemmed the risk of a broader financial crisis.
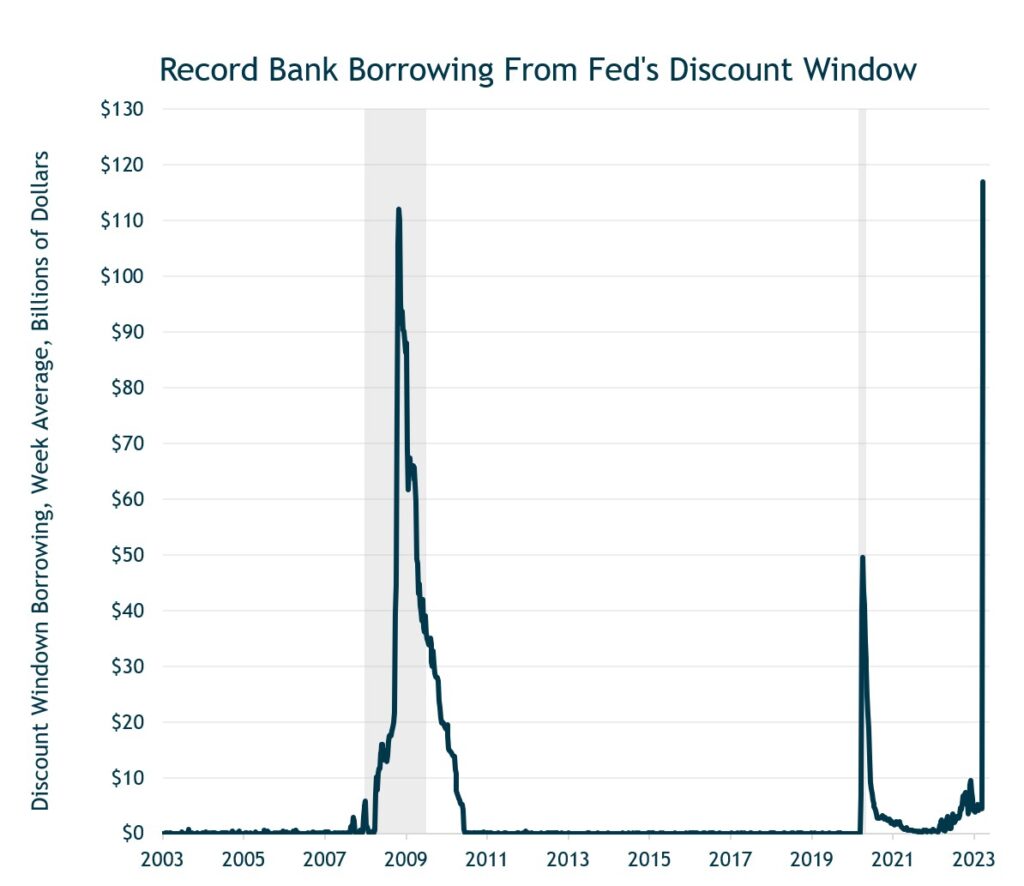
Source: Federal Reserve. Shaded areas indicate NBER-defined recessions. Data as of 3/22/2023
Core Inflation Measures Remain Far Above the Fed’s 2% Target
- Although inflation peaked last year and has come down, it remains much too high for the Fed’s 2% long-term target. February’s year-over-year core CPI inflation rate was 5.5%, while core CPE inflation – the Fed’s preferred measure – clocked in at 4.6%.
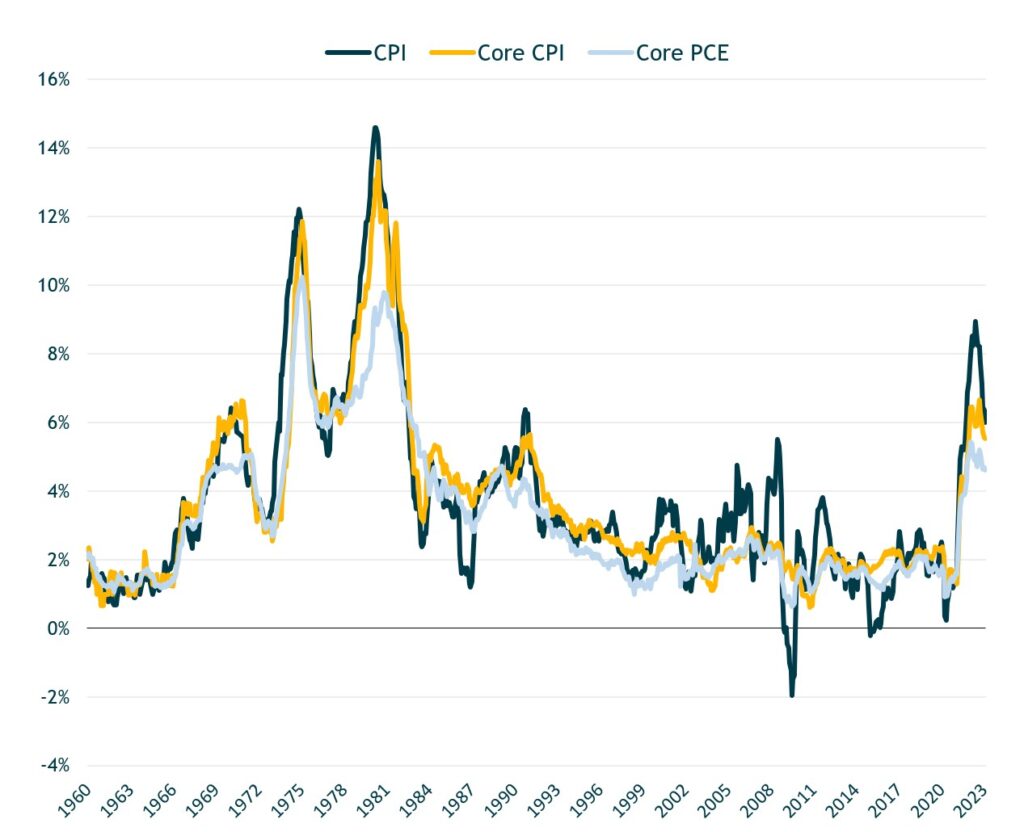
Source: U.S. Bureau of Labor Statistics and U.S. Bureau of Economic Analysis. Data as of 2/28/2023.
A Sharp and Sustained Inverted Curve is Another Recessionary Signal
- A second recession indicator is the inverted Treasury yield curve – meaning short-term Treasury yields are above longer-term Treasury bond yields.
- An inverted yield curve is unusual and usually (but not always) a leading indicator of recession. But, as with the leading economic indicator (LEI), the timing from the initial curve inversion and the onset of recession has been highly variable.
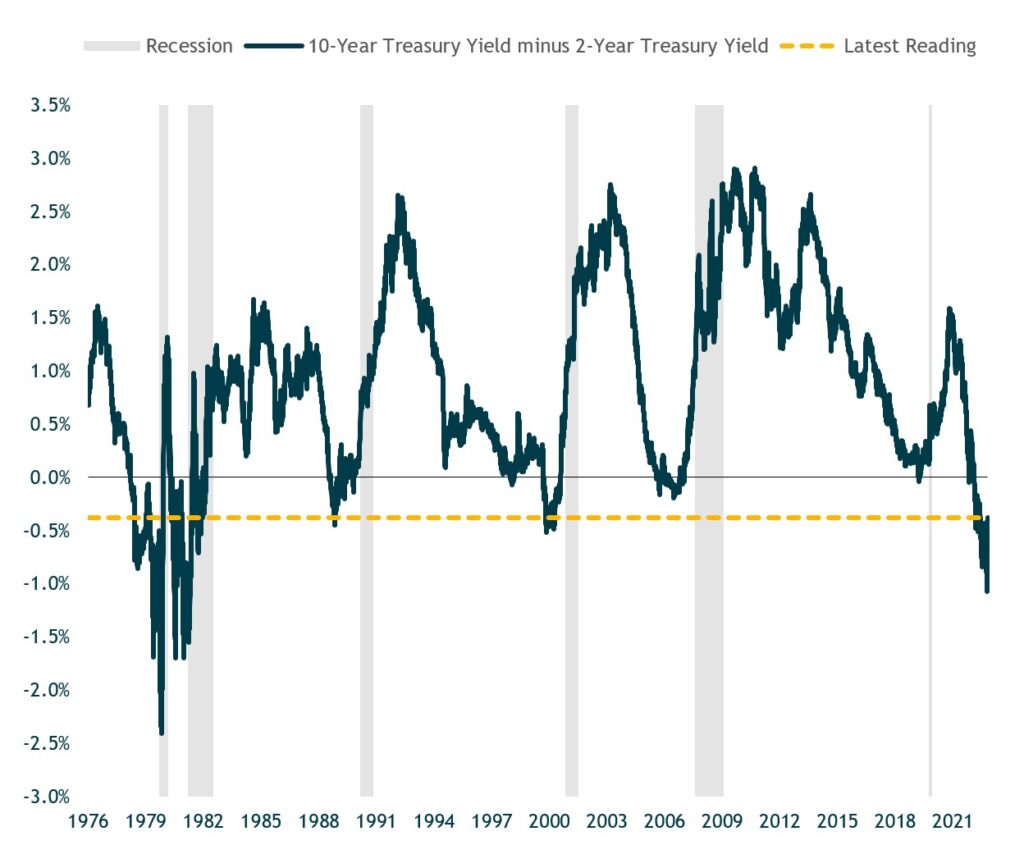
Source: Federal Reserve Bank of St. Louis. Data as of 03/24/2023. Shaded regions represent NBER-defined recessions.
Emerging Market Stock Valuations Are Attractive and at a Significant Discount to U.S. Stocks
- Emerging market and European stock valuations are attractive and much cheaper than U.S. stocks.
- We favor EM stocks right now based on their higher expected returns, which are a function of what we expect will be faster sales growth and improving profit margins over the next several years.
- Monetary policy is also likely to start loosening next year across many EMs as inflation comes down, which should be another support for EM equity markets.
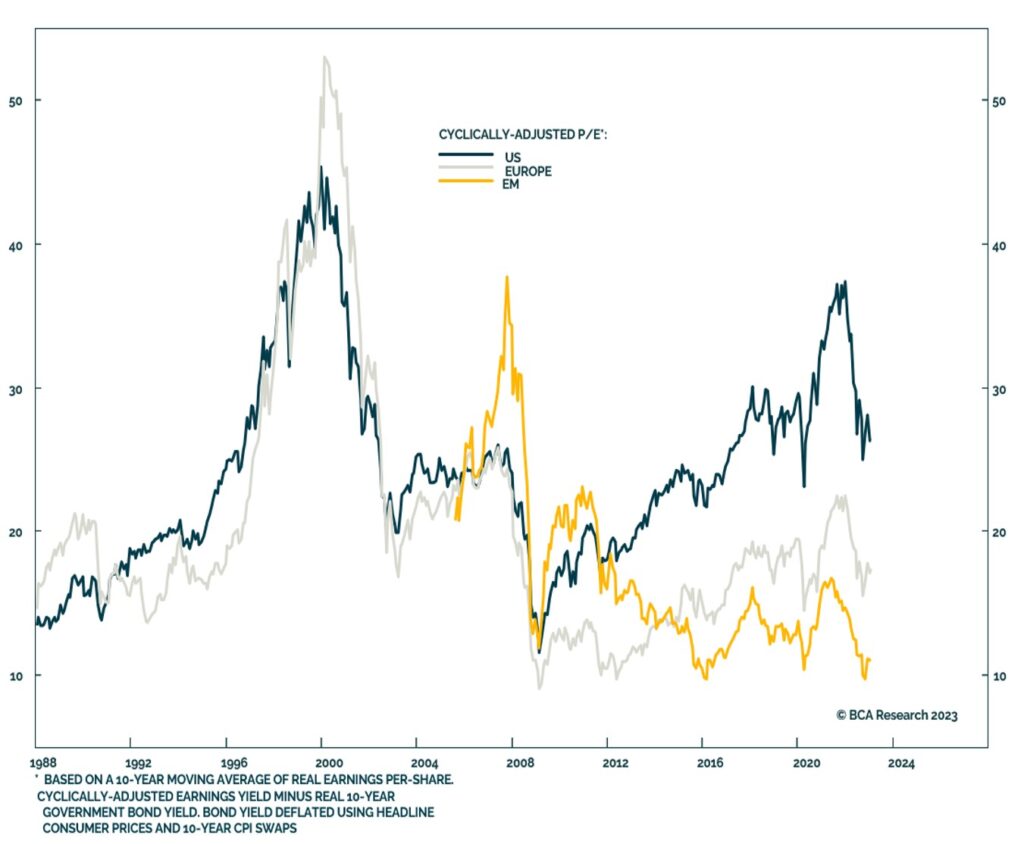
Source: BCA Research. Data as of 3/31/2023.
Bond Yields and Expected Returns Have Increased Meaningfully
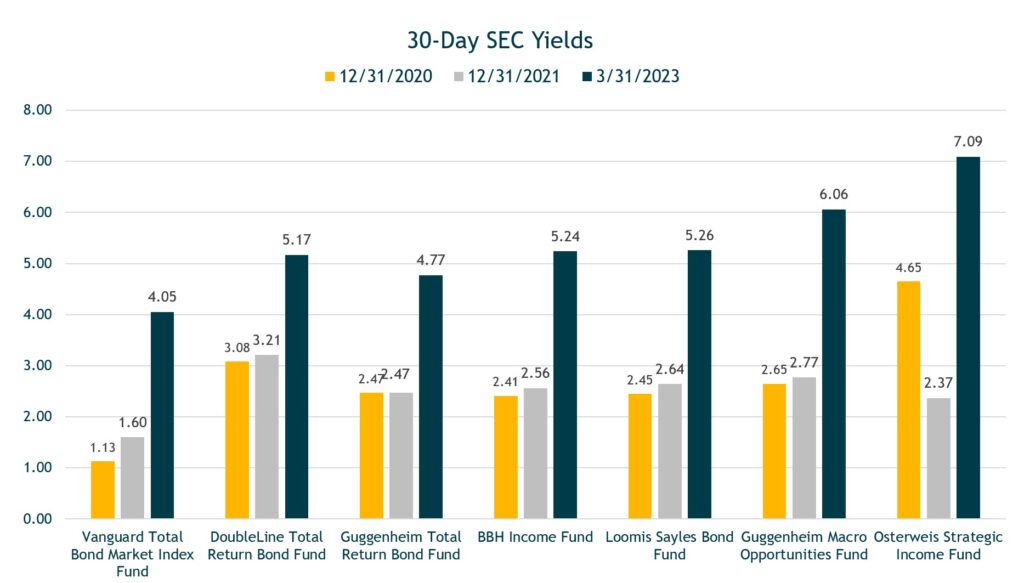
Source: Morningstar Direct. Data as of 3/31/2023.
The Fed Expects to Hold Rates at Current Levels but the Market Expects Cuts
- At his March FOMC press conference, Powell reiterated that he and his Fed colleagues do not expect to cut rates this year. However, the fed funds futures market doesn’t believe him; it is currently pricing-in roughly 75 to 100bps of Fed rate cuts this year. It seems the futures market is implicitly assuming an economic slowdown, recession or crisis that forces the Fed to sharply ease. One thing is certain: the fed funds futures and the Fed projections can’t both be right on this.
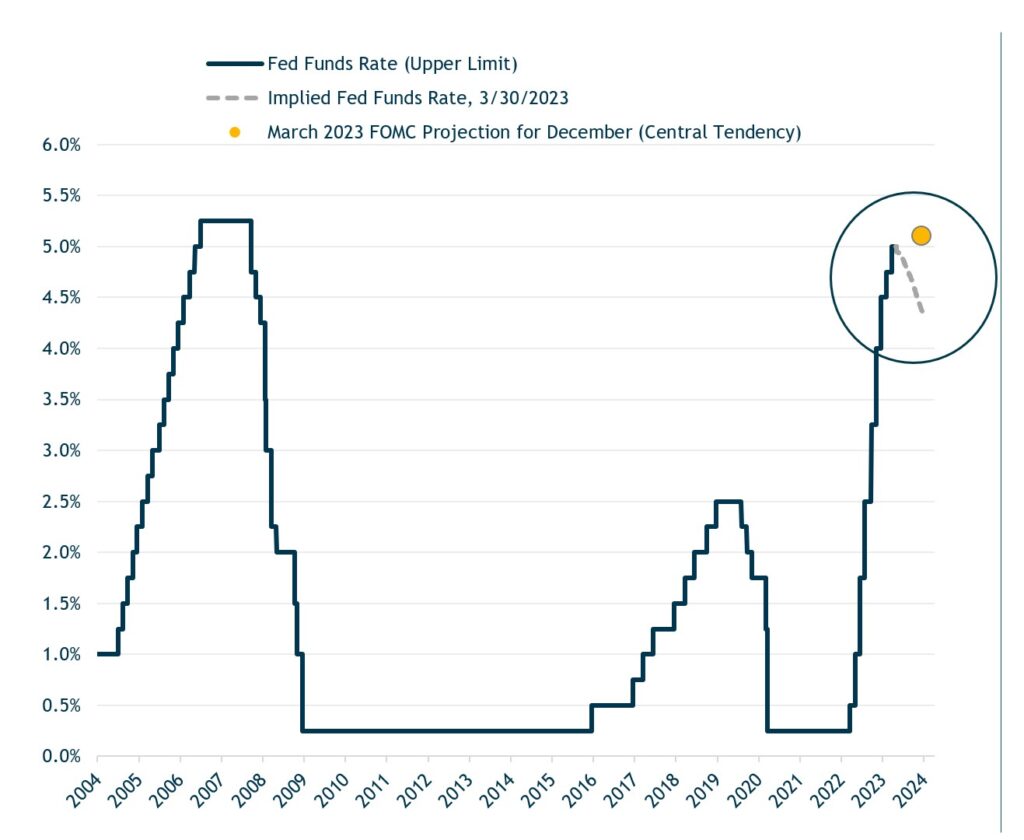
Source: Bloomberg LP and Board of Governors of the Federal Reserve System. Data as of 3/30/2023.
Higher Yields Make Bonds Attractive Relative to Stocks
- The relative valuation/attractiveness of U.S. stocks versus core bonds (known as the “equity risk premium”) continues to slightly favor bonds relative to historical averages.
- As the Fed has continued to raise short-term interest rates, the yield premium between stocks and “cash” (short-term Treasury bills) has shrunk even further.
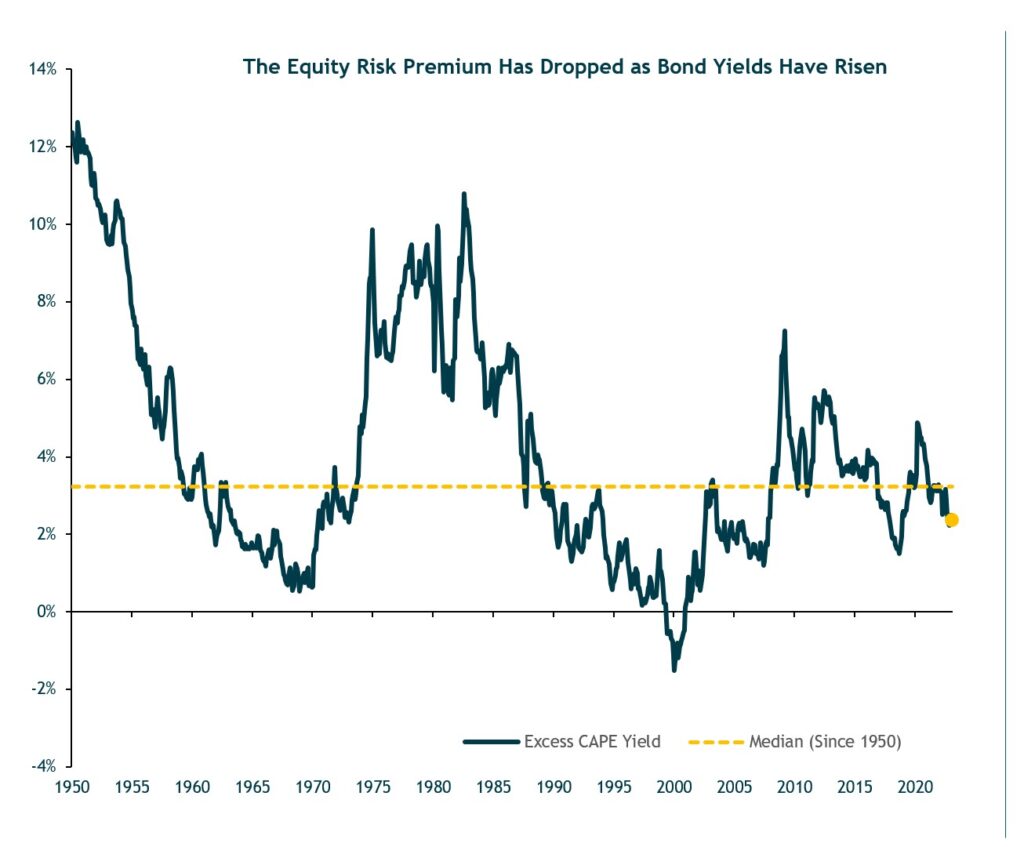
Source: Robert J. Shiller, S&P Dow Jones Indices, iM Global Partner. Data as of 02/28/2023.
Europe and EM Stocks are Selling at Deep Discounts vs. US Stocks
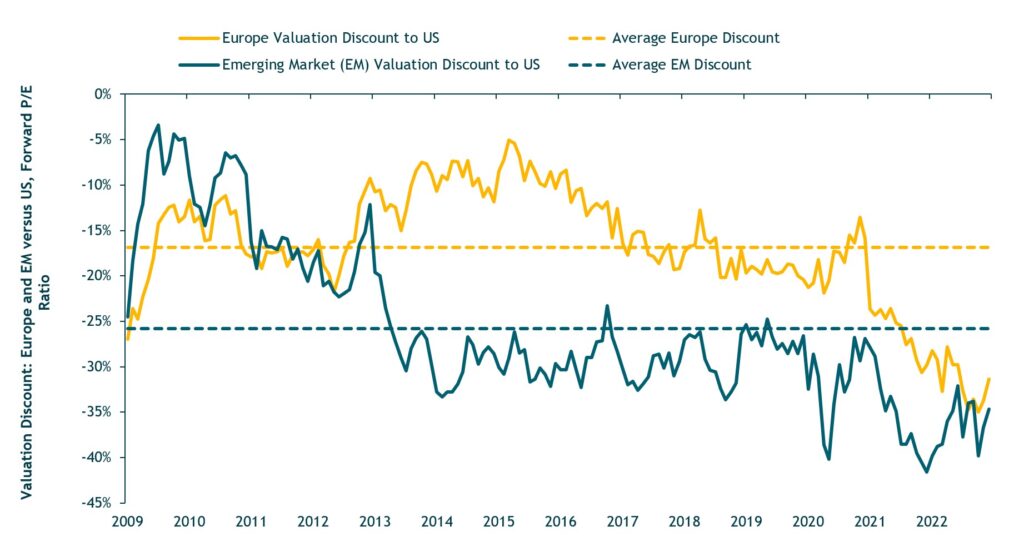
Source: Bloomberg LP. Data as of 12/31/2022.
Core Consumer Goods Inflation Has Come Down, But Core Services Inflation Remains High
- As we noted at year-end, it is the services component of inflation that is the concern now; price hikes for consumer goods have dropped dramatically as supply and demand have come into balance after the pandemic-era dislocations.
- There are good reasons to expect core CPI services inflation to recede as the year goes on. The largest component of the core services inflation basket is shelter, which includes housing rental prices. Given the slowdown in the housing market over the past year as well real-time measures of rent declines, most economists expect shelter inflation to moderate over the course of the year.
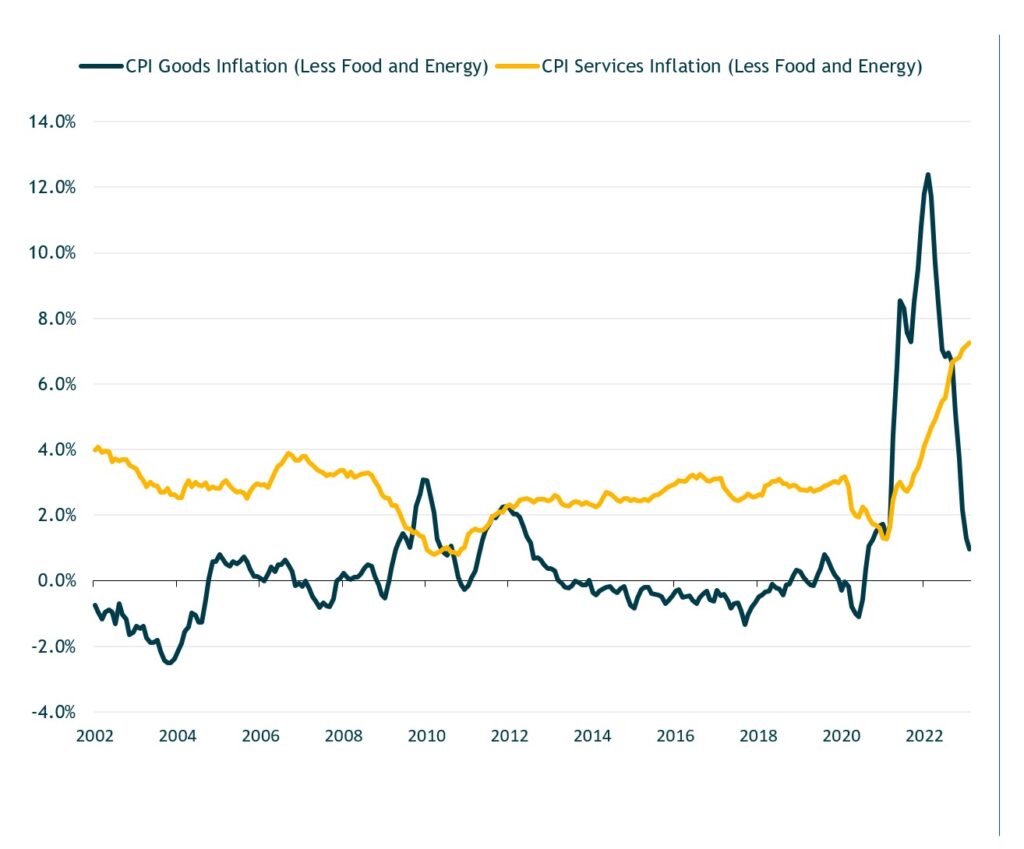
Source: U.S. Bureau of Labor Statistics and U.S. Bureau of Economic Analysis. Data as of 2/28/2023.
Bear Market Drawdowns (with a recession) have Averaged around 35%…Then Rebounded an Average 62% Over the Next Two Years
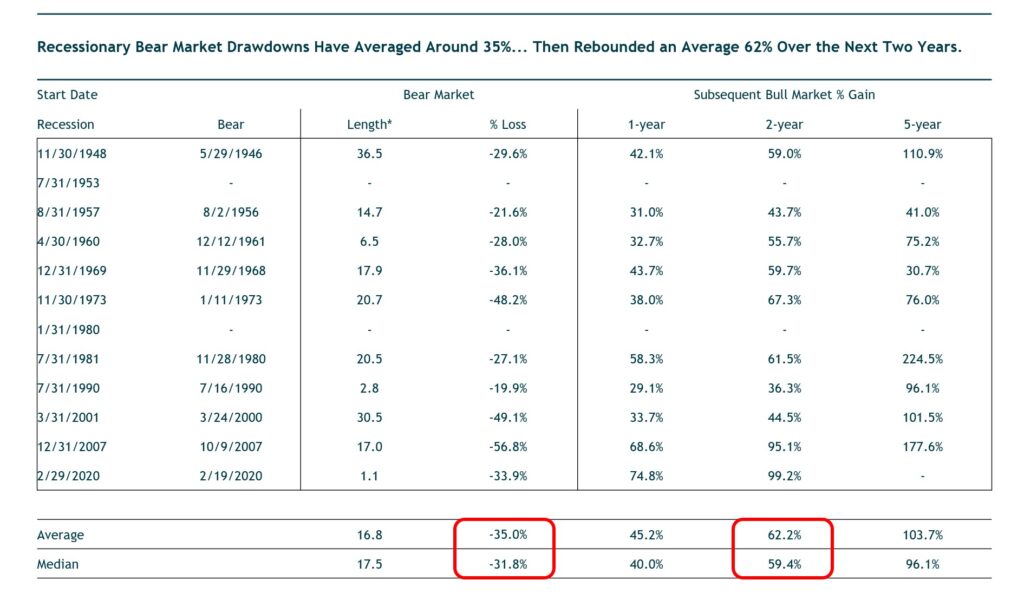
Source: Board of Governors of the Federal Reserve System and Morningstar Direct. *Length is measured in months. Data as of 3/31/2023.