Market Review
- It’s been an extremely difficult year for investors, with equity markets falling into bear market territory (down more than 20%) and “low-risk” bond markets registering low double-digit losses. Over the past few months, the economic backdrop has worsened with sustained high inflation and slowing growth, as the Federal Reserve and other global central banks aggressively tighten monetary policy. Exogenous shocks – the Russian war on Ukraine and China’s zero-COVID lockdowns – continue to further disrupt the global economy and financial markets.
- Global stocks (MSCI ACWI Index) fell 15.7% for the quarter and are down 20.2% year-to-date. The S&P 500 dropped 16.1% for the quarter and is down 20% year-to-date. Developed international markets (MSCI EAFE index) were down 14.5% for the quarter and down 19.6% year-to-date. Emerging market stocks (MSCI Emerging Markets Index) held up a bit better, dropping 11.4% for the quarter, and down 17.6% year-to-date.
- Core investment-grade bonds were pummeled again in the second quarter with the benchmark Bloomberg U.S. Aggregate Bond Index (the “Agg”) dropping 4.7%. This puts the “safe-haven” Agg down an incredible 10.3% year-to-date – its worst first-half ever.
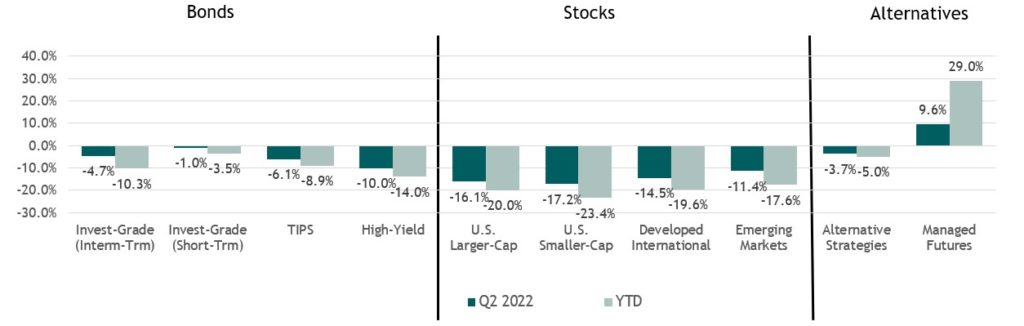
Performance reflects index returns as follows (left to right): Bloomberg US Aggregate, Bloomberg US TIPS, Bloomberg US Corporate 1 – 3Y, ICE BofA US High Yield, S&P 500, Russell 2000, MSCI EAFE, MSCI EM, HFRX Global Hedge Fund, Dow Jones Credit Suisse Hedge Managed Futures. Source: Morningstar Direct. Data as of 6/30/2022.
2022 Has Been A Historically Difficult Period for Stocks and Bonds
- Global stocks and US core bonds are both down year to date as markets digest higher inflation, rising interest rates, and geopolitical uncertainty.
- As we’ve discussed for some time, rising inflation and rising interest rates creates challenges for both stocks and bonds, and in turn, for a portfolio comprised only (or largely) of core bonds and stocks. Diversification into other asset classes, market segments, and alternative strategies can be particularly valuable in such an environment.
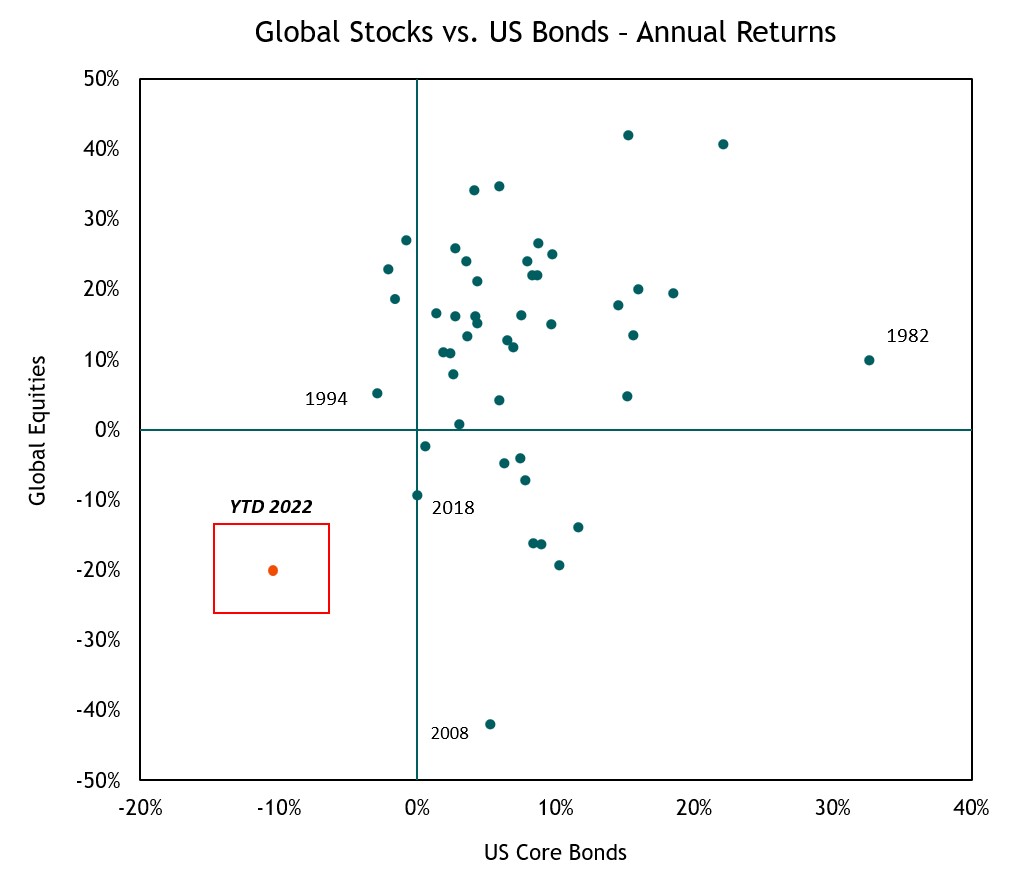
Global Equities represented by the MSCI World from 1977 through 1987 and the MSCI ACWI from 1988 through 2022. US Core Bonds represented by the Bloomberg US Agg Bond. Source: Morningstar Direct. Data as of 6/30/2022.
Worst First-Half Performance for the 60/40 Portfolio Going Back to 1950
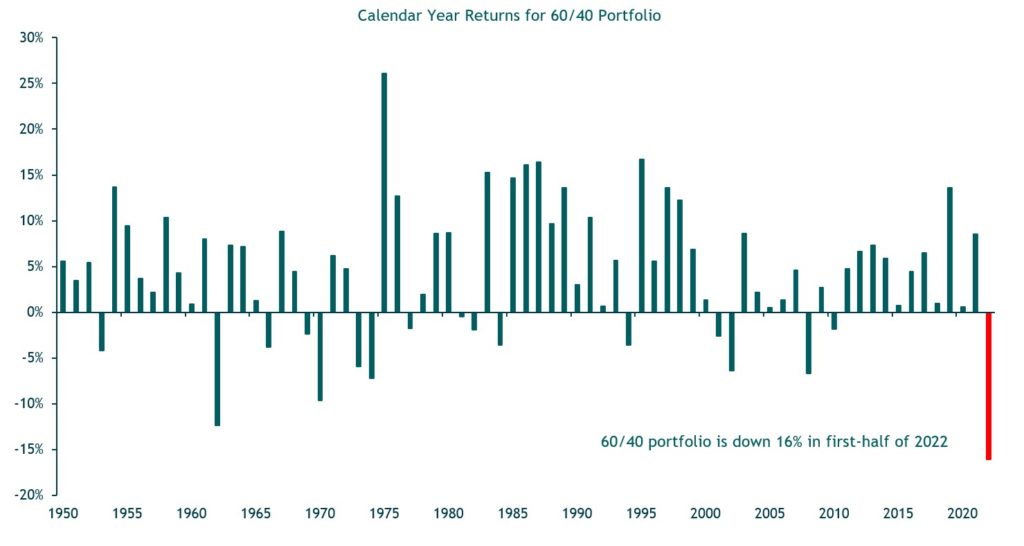
Data as of 6/30/2022. Source: Morningstar Direct. From 1950 through 1975, 60/40 portfolio is represented by 60% S&P 500 Index and 40% Ibbotson SBBI US Intermediate-Term Government Bond Index. From 1976 onward, portfolio is represented by 60% S&P 500 Index and 40% Bloomberg US Aggregate Bond Index. Portfolio rebalanced annually
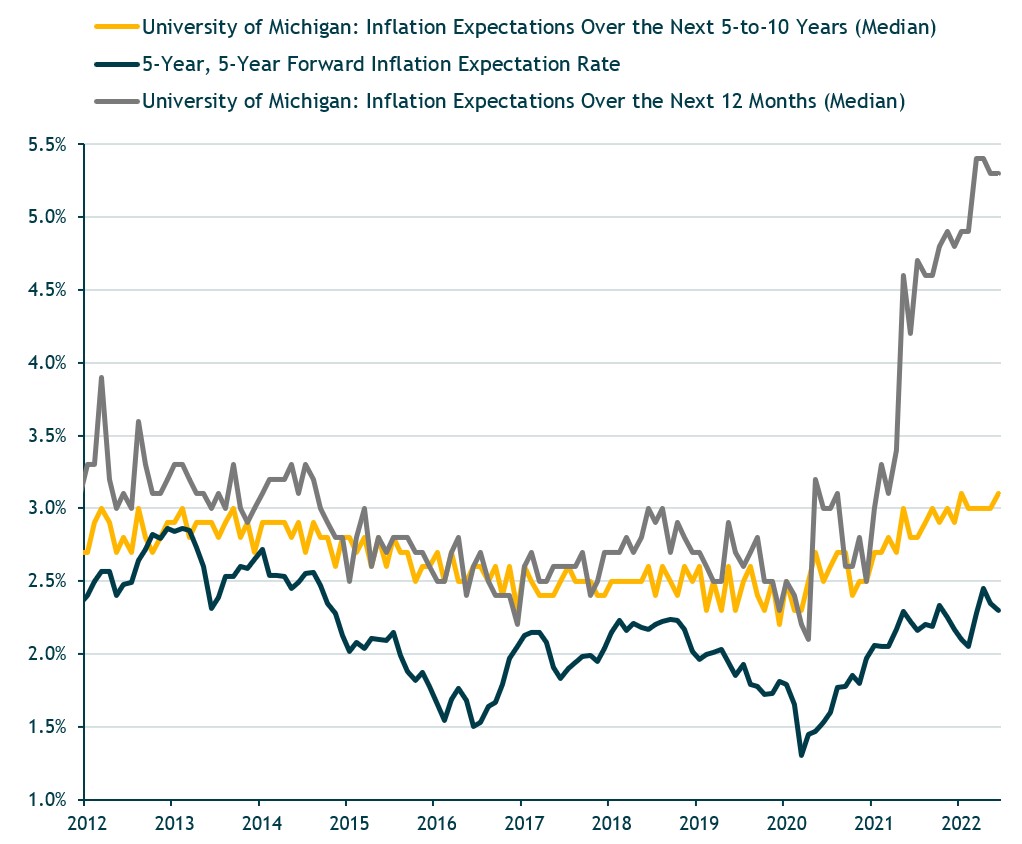
Short-Term Inflation Expectations Are Sharply Higher But Longer-Term Expectations Remain Within the Fed’s Target Range (So Far)
- While short-term inflation expectations have spiked, longer-term inflation expectations remain mostly “anchored” in a range consistent with the Fed’s 2% long-term core inflation target.
- Should the longer-term measures move higher, we’d expect the Fed to accelerate its tightening pace
Most Global Central Banks Are Raising Rates – Except China and Japan
- Nearly 80% of global central banks have been raising interest rates. This is the highest rate since just before the 2008 financial crisis.
- Notable exceptions continue to be the European Central Bank (ECB), the Bank of Japan (BOJ), and the Peoples Bank of China (PBOC). However, the ECB has essentially guaranteed it will begin hiking rates in July.
- The PBOC continues to modestly ease monetary and credit conditions in response to China’s sharp COVID-related growth slowdown this year. And, uniquely among global economies, inflation is not a concern, with its latest headline CPI rate at 2.1%.
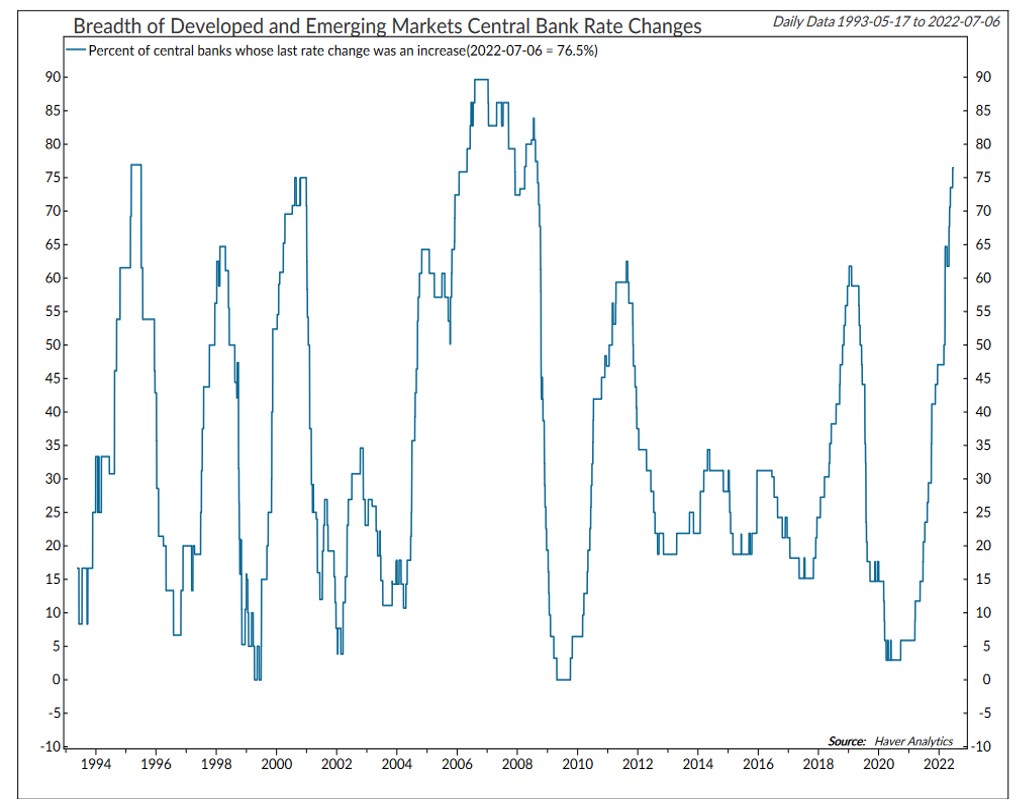
Source: Ned Davis Research.
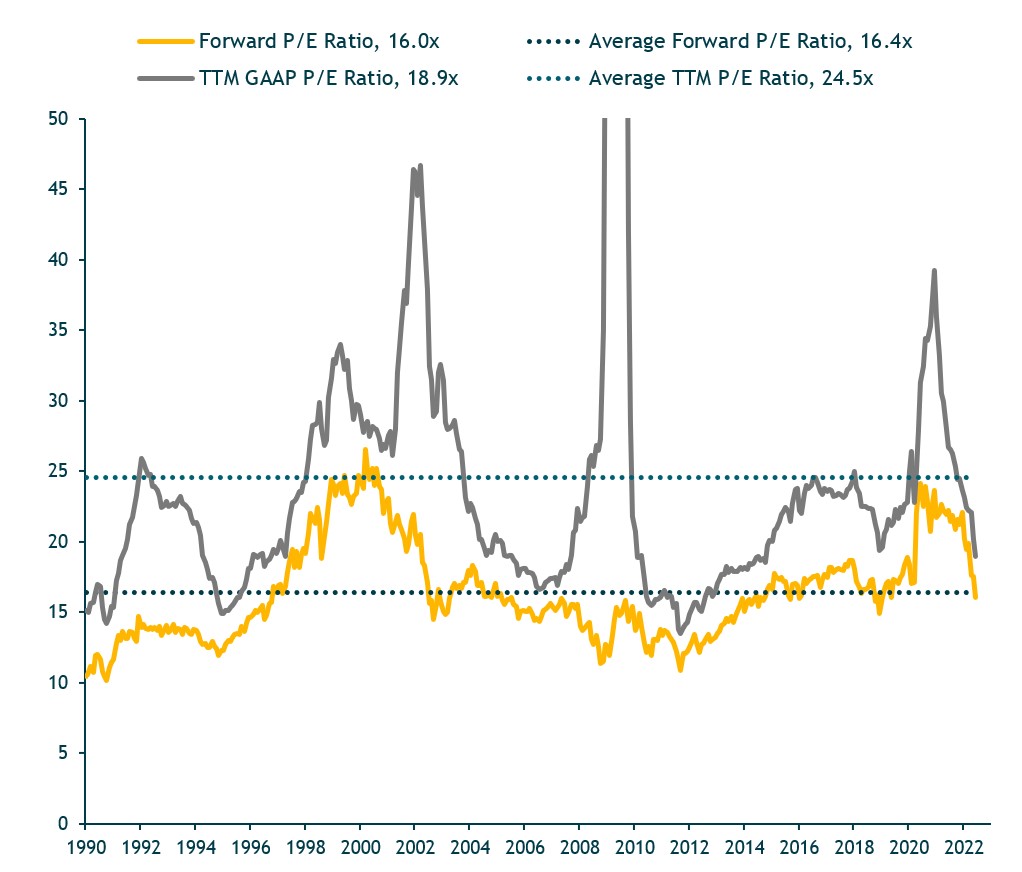
Valuations for U.S. Stocks Are More Attractive Following the Recent Selloff…
- S&P 500 trailing and forward price/earnings (P/E) ratios have dropped a lot this year but are still not historically cheap.
- The entire drop in the S&P 500 this year has been due to valuation compression, i.e., a sharp decline in the “P” of the market’s P/E ratio. Earnings have grown while the market price level has declined, causing a nearly 30% reduction in the market’s 12-month forward P/E ratio
.
Europe and EM Stocks are Selling at Steep Discounts vs. U.S. Stocks
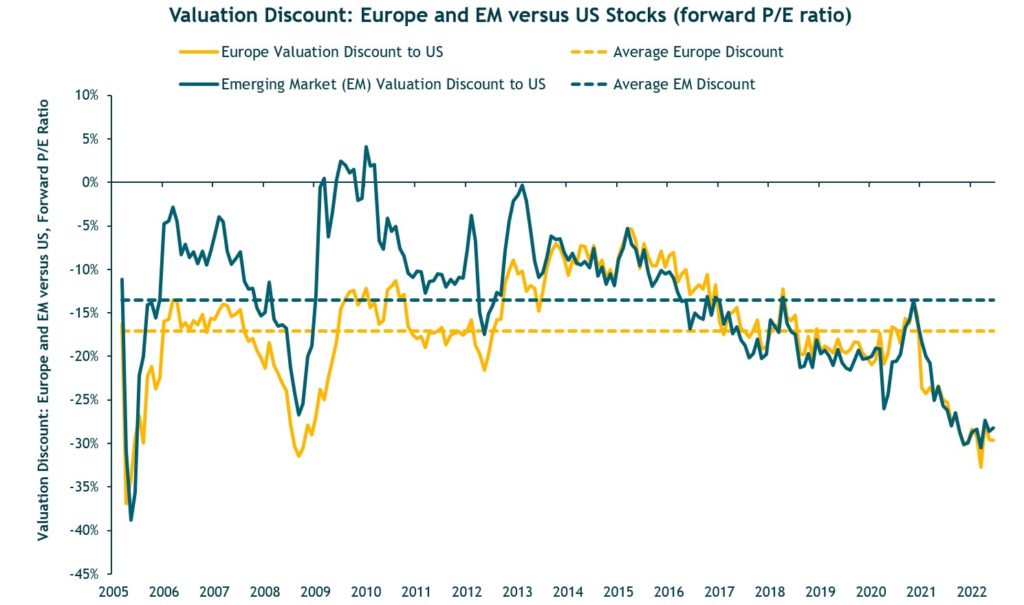
Source: Bloomberg.
Rising Rates Have Hurt Bond Returns but Should Result in Higher Yields and Better Expected Returns
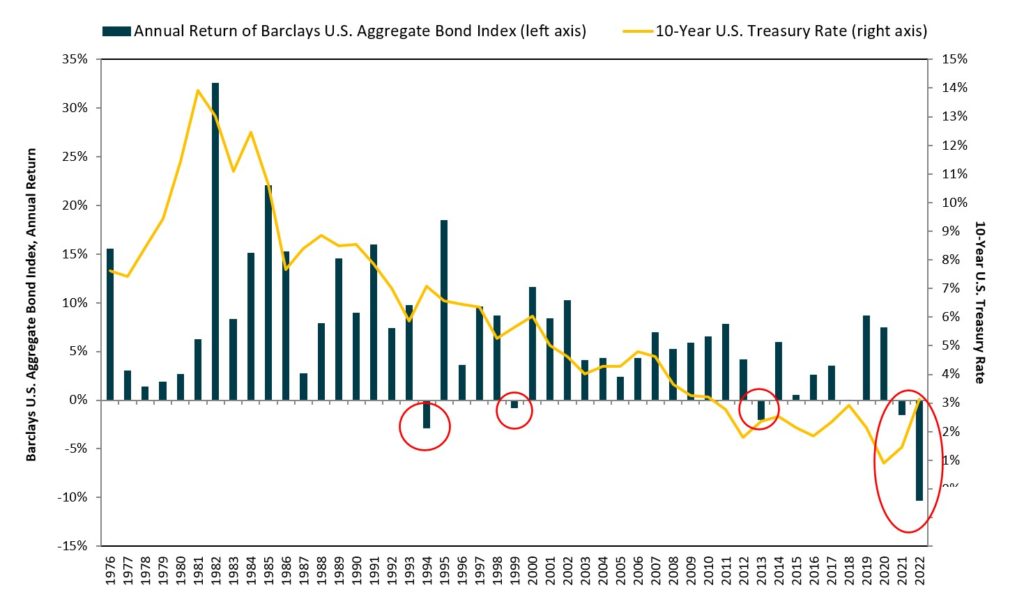
Source: Morningstar / Federal Reserve. Data as of 6/30/2022.
Owning/Buying U.S. Stocks After a 25% Market Decline Typically Pays Off for Longer-Term Investors
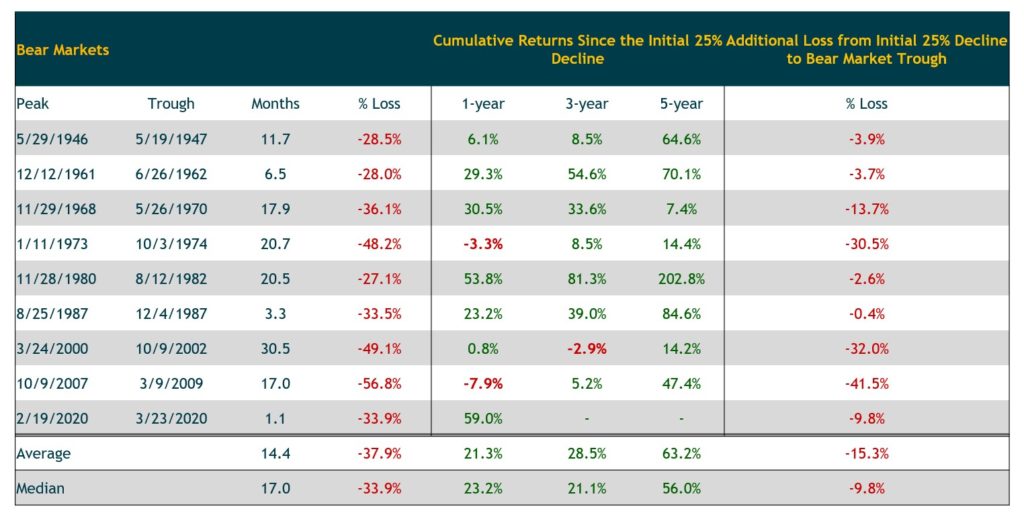
What Happens After Bear Market Declines
- Historically, market declines are followed by market strength and typically grow stronger the longer the time period measured.
- This observation speaks to the importance of viewing investments over a long-time horizon.
- Note that some of the five- and 10-year performance shown in the chart overlap periods, but the results reflect what an investor experienced following the 20%-plus market drop.
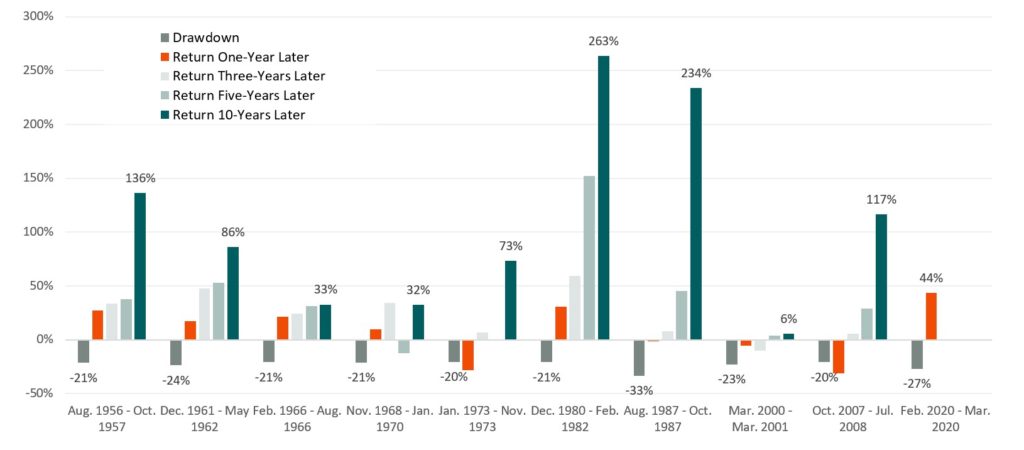
Bear Market (decline of 20% of more from previous high). Source: Morningstar Direct.