Market Review
- The S&P 500 Index continued to reach new highs throughout the quarter, gaining 4.3% in the three-month period. Large-cap stocks (S&P 500 Index) decidedly outperformed small-cap stocks (Russell 2000 Index), and growth stocks (Russell 1000 Growth) again beat value stocks (Russell 1000 Value).
- Overseas, results were mixed with developed international stocks (MSCI EAFE) falling 0.2%, while emerging markets stocks (MSCI EM Index) rose 5.0% for Q2 2024.
- In the bond markets, the benchmark 10-year Treasury yield was flat ending the quarter at 4.2% resulting in a small 0.1% gain in the interest-rate sensitive Bloomberg US Aggregate Bond Index. Credit performed relatively well in the quarter, as high-yield bonds (ICE BofA High Yield Index) rose just over 1.0%.
- Managed Futures (SG Trend Index) lagged this quarter, finishing down over 3%. However, the year-to-date returns are still an impressive positive 8.7%. Multistrategy alternatives (US Fund Multistrategy Index) were down slightly in the quarter but remain up a respectable 4.5% year to date.
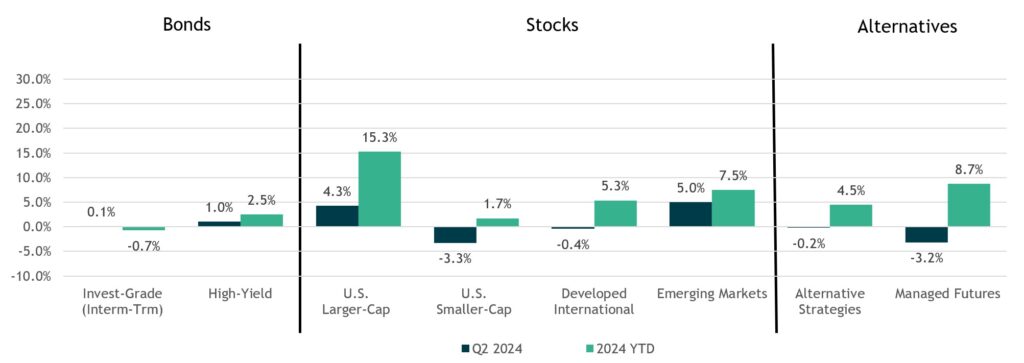
Performance reflects index returns as follows (left to right): Bloomberg US Aggregate, ICE BofA US High Yield, S&P 500, Russell 2000, MSCI EAFE, MSCI EM, Morningstar US Fund Multistrategy Index, SG Trend Index. Source: Morningstar Direct. Data as of 6/30/2024.
Inflation Continues to Moderate but Remains Above the Fed’s 2% Target
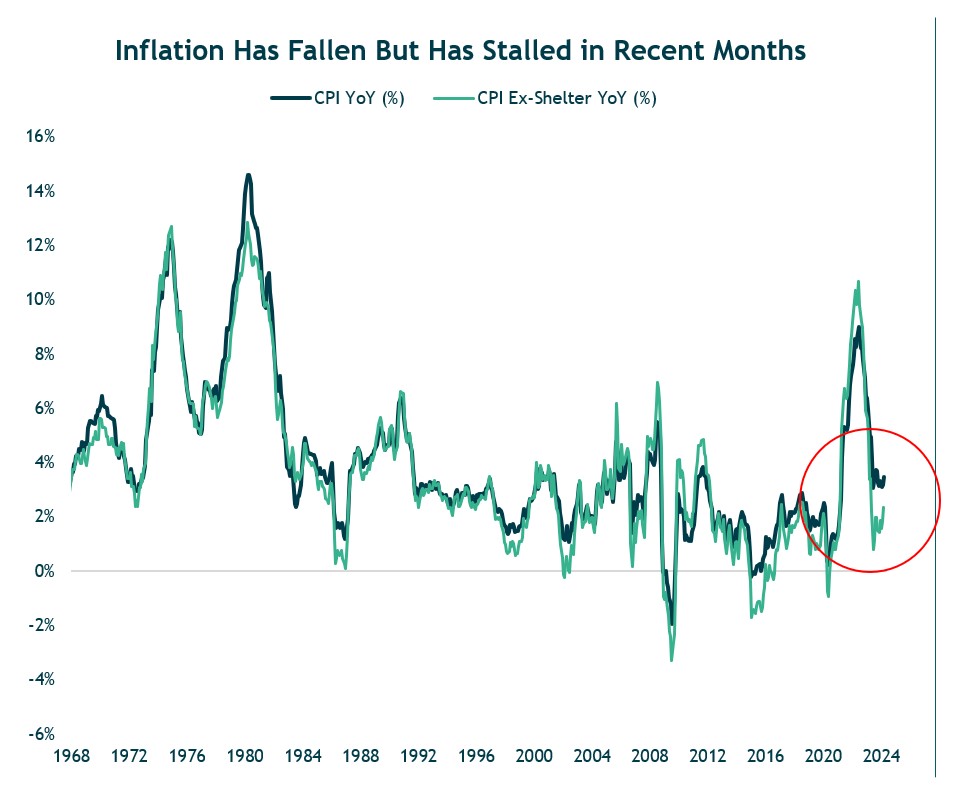
- CPI inflation has declined but remains above the Fed’s stated 2% target calling into question Fed rate cuts.
- We believe the Fed is inclined to cut rates this year, recognizing the risks of waiting too long.
Source: U.S. Bureau of Labor Statistics. Data as of 6/30/2024.
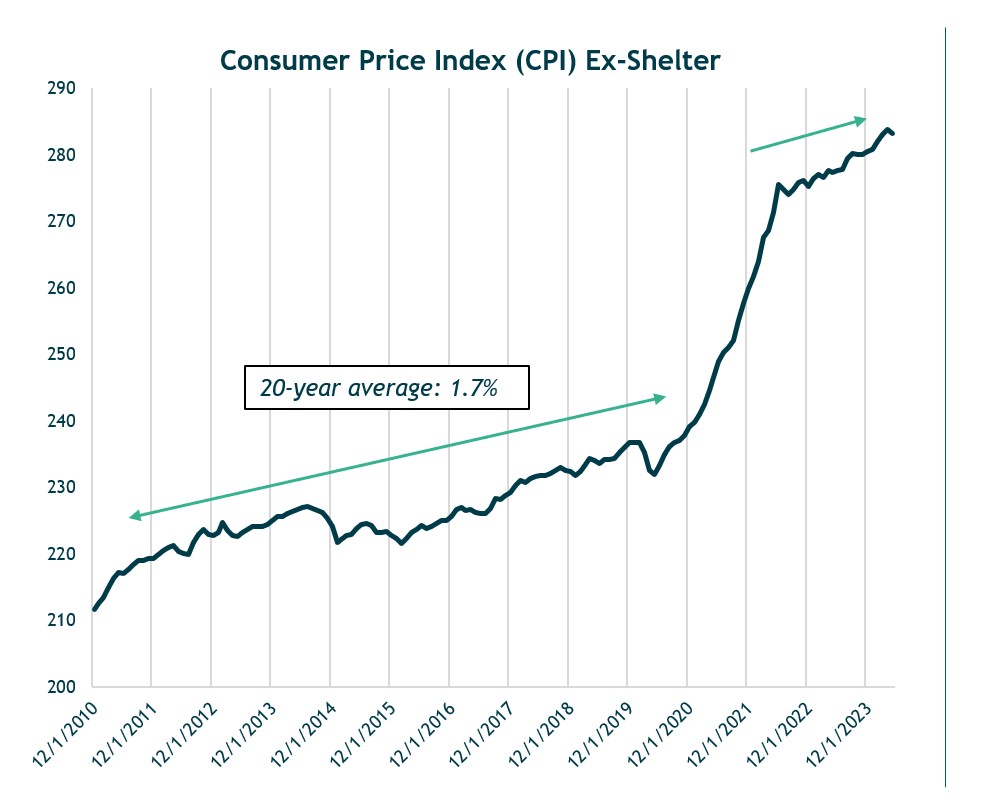
We Expect Shelter Related Inflation to Cool Lowering Overall Inflation
- We expect the shelter component to gradually decline over the remainder of the year, albeit not in a straight line, and thus CPI too.
- This chart shows that since mid-2022, CPI ex-shelter has increased at 1.76% annualized over the last 12 months. In other words, across most of the economy, price increases have been in line with the Fed’s target.
Source: Federal Reserve. Data as of 6/30/2024.
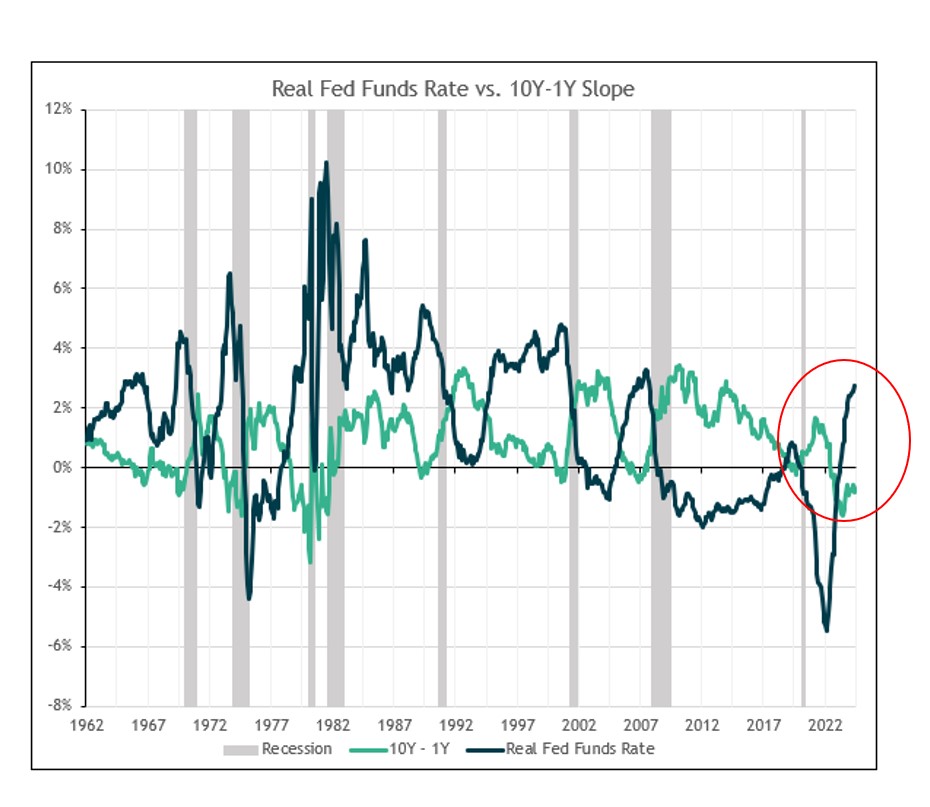
Monetary Policy is Moving Towards Restrictive Levels
- With the steady decline in inflation, we believe Fed policy has crept into borderline restrictive territory.
- An inverted yield curve (green line below zero), when combined with a higher real fed funds rate (i.e., inflation adjusted, blue line) has predicted recession.
- It’s only more recently that Fed policy has started to move toward restrictive levels due to the combination of a higher fed funds rate and falling inflation. Simply put – to the extent that inflation continues to fall, and the Fed keeps rates unchanged, monetary policy will become proportionately more restrictive, and could reach a level that significantly slows the economy.
Source: Bloomberg LP. Data as of 6/30/2024
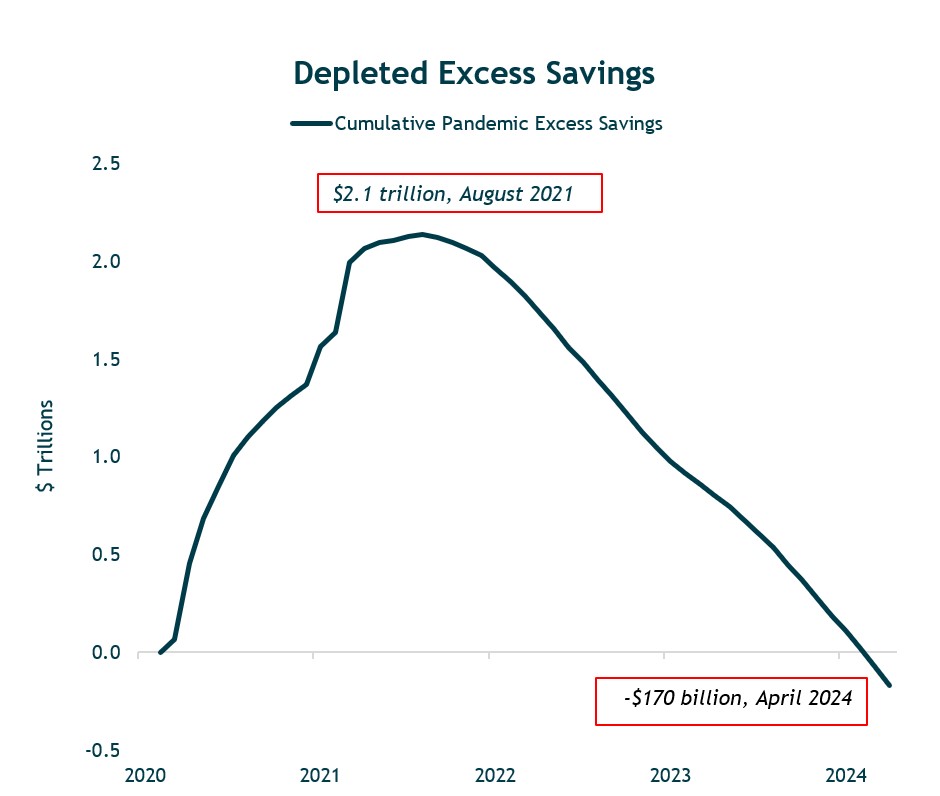
However, Consumers Have Burned Through Pandemic Related Savings
- As the economy and corporate earnings have continued to grow, it is apparent that policy has not been too restrictive, or at a minimum, rate increases are taking longer than expected to have an impact.
- The consumer has driven U.S. economic growth for the past three years, thanks to improvement in both employment and real wages, along with excess savings accrued during the pandemic.
Source: Bureau of Economic Analysis. Data as of 6/30/2024.
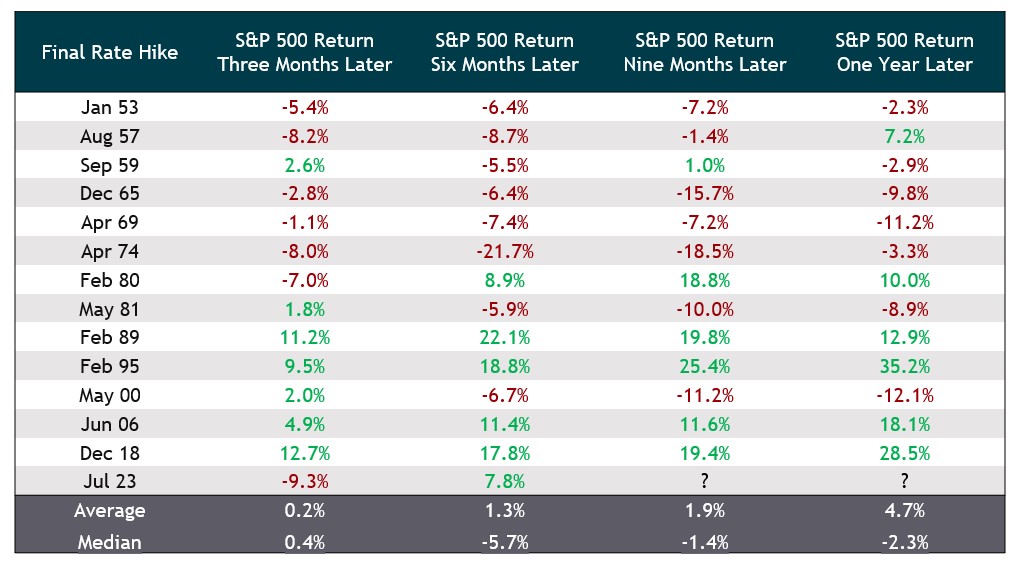
Following a Fed Tightening Cycle Equity Returns Have Generally Been Positive in Lower Inflation Environments
- When inflation is not elevated, the Fed can move to a more accommodative stance much sooner, which has generally been positive for equities. This can be seen in the post 1980’s in terms of the much shorter time between the final rate hike and the subsequent rate cut.
- Most of the negative outcomes occurred during bouts of elevated inflation (particularly through the 60’s and 70’s). Because of higher inflation, the Fed will typically maintain a more restrictive policy – i.e., it will take them longer to pivot and cut rates (higher for longer).
Source: iM Global Partner and Board of Governors of the Federal Reserve System. Data as of 3/31/2024. S&P 500 Index price returns shown.
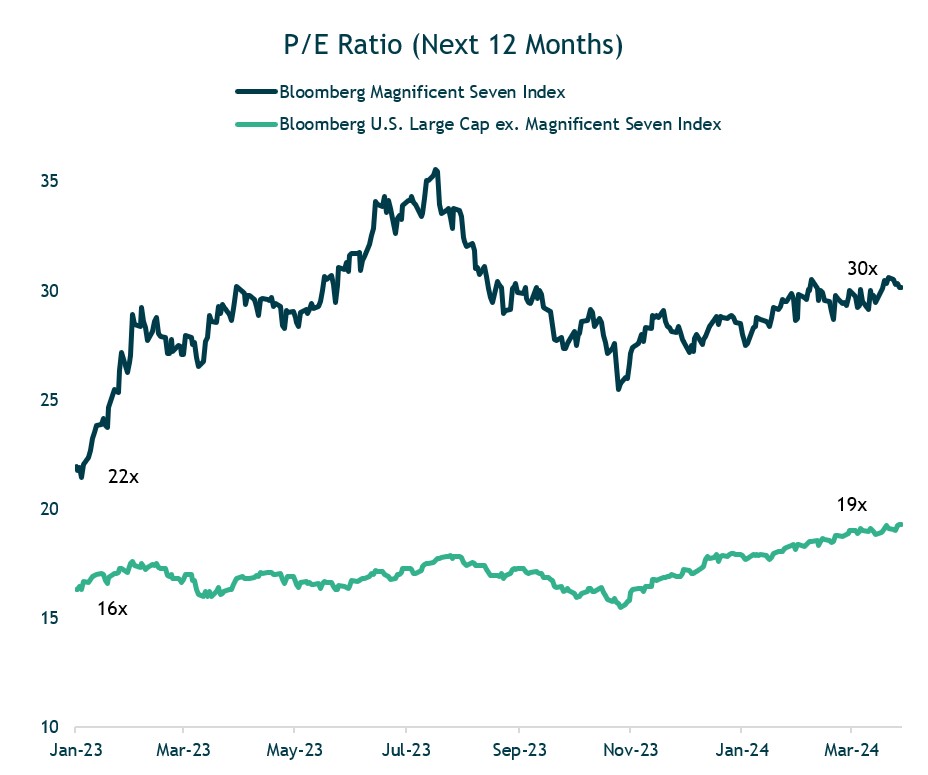
We Expect the Rally in U.S. Stocks to Broaden Out Beyond Large Cap Growth
- Our portfolios have meaningful exposure to many of these strong-performing mega-cap stocks, which has benefitted portfolio performance. But we remain balanced, also owning larger-cap value and smaller-cap U.S. stocks that are trading at more attractive valuations and offer important diversification benefits.
- In March, we rebalanced our U.S. equity allocation to increase exposure towards higher-quality, more attractively valued parts of the U.S. equity market (value stocks and smaller-cap stocks) that could benefit from an ongoing economic expansion and a broadening out of the market rally.
Source: Bloomberg LP, iM Global Partner. Chart concept courtesy of BCA Research. Shaded regions are NBER-defined recessions. Data as of 6/30/2024.
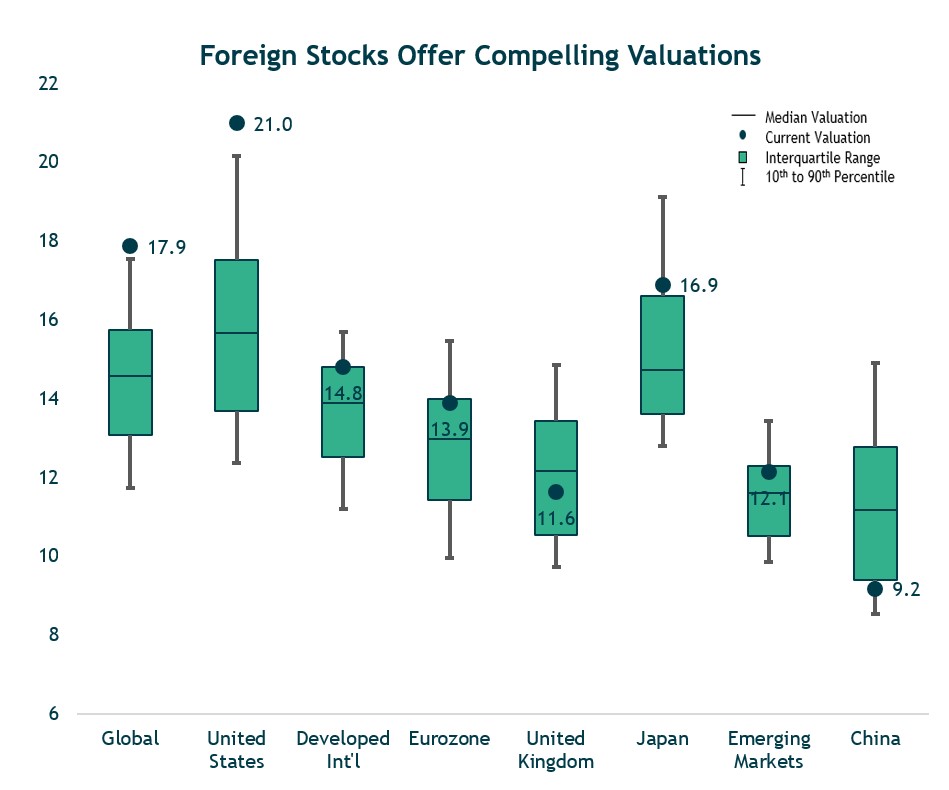
Foreign Stock Valuations are Attractive Versus the U.S.
- Overall, our global equity allocation remains neutral with respect to U.S., developed international, and emerging market stocks.
- That said, given their lower starting valuations, our five-year expected return estimates for developed international and emerging markets equities are high-single to low-double digit annual average returns – attractive both in absolute terms and relative to U.S. stocks.
Source: Bloomberg LP. Data from 1/1/2006 to 6/30/2024.
Starting Bond Yields are Highly Correlated With 5-Year Total Returns
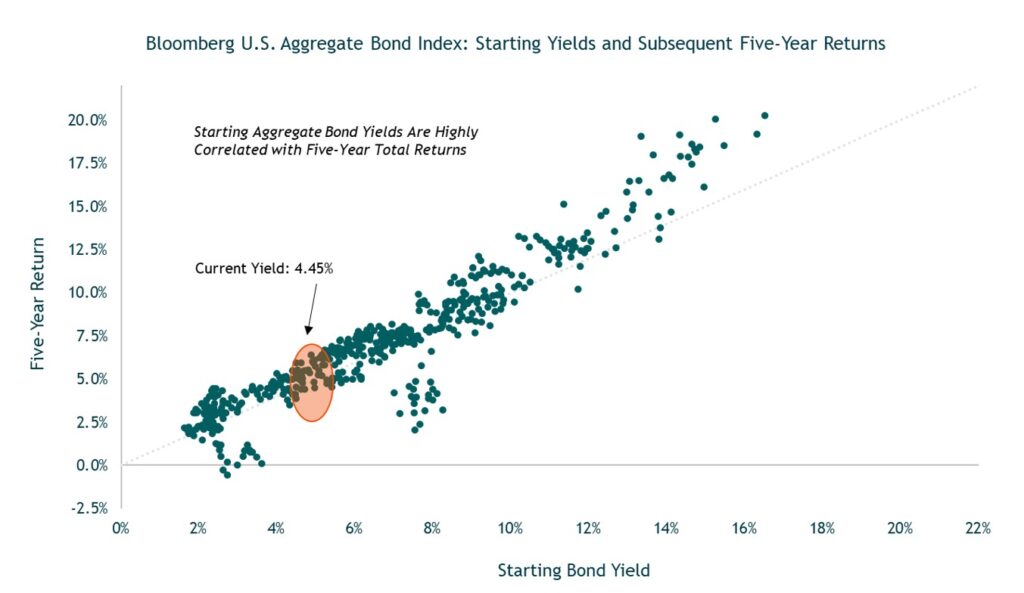
Source: Bloomberg LP. Data as of 6/30/2024.
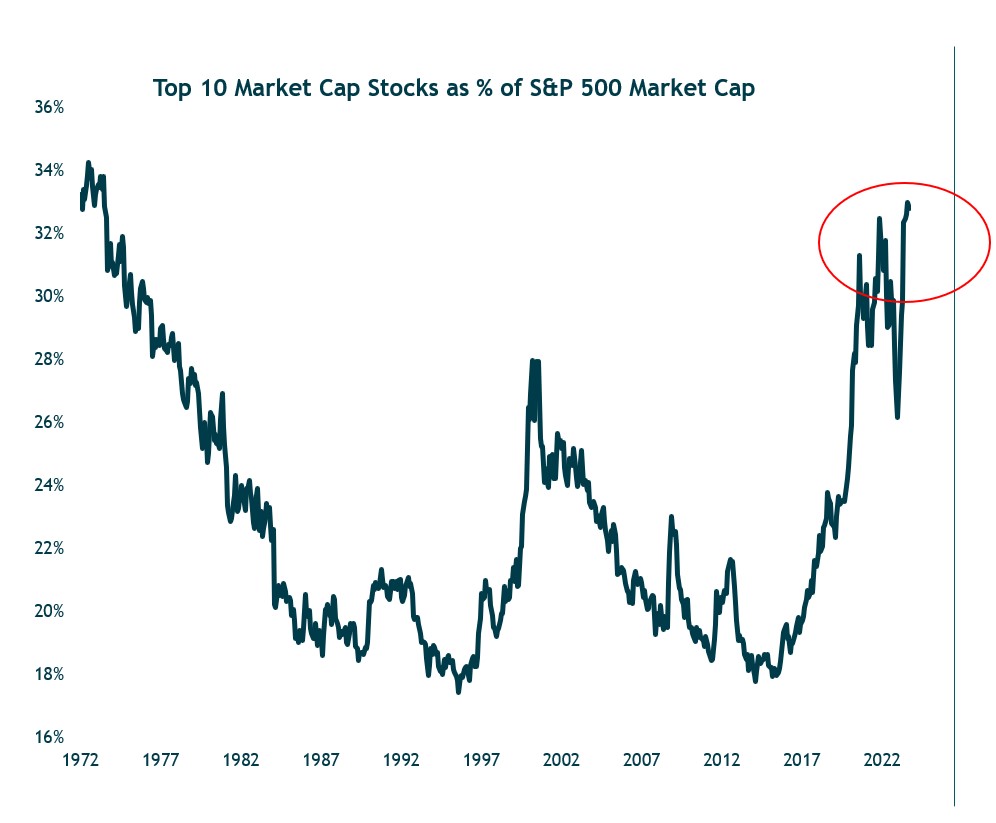
Concentration Within the S&P 500 is at its Highest Levels in 50 Years
- The concentration within the S&P 500 has soared past where it was in 2021 and the tech bubble. It is closing in on a level last seen during the early-1970s—a period known for the leadership of the Nifty Fifty stocks.
- This chart shows the 10 largest stocks accounting for more than 30% of the total market capitalization of the S&P 500.
Source: Ned Davis Research. Data as of 6/30/2024.
