Asset Class Returns
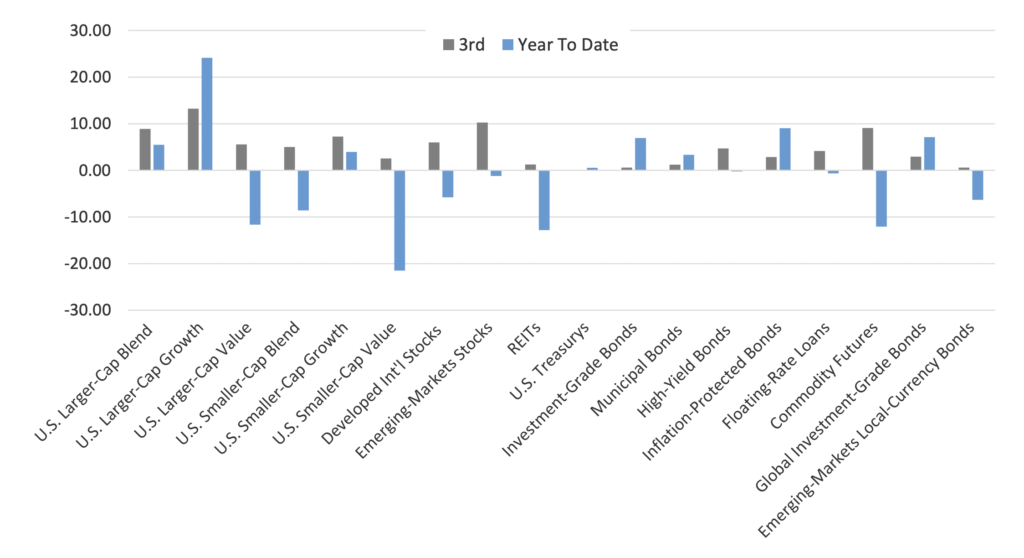
Source: Morningstar. Data as of 9/30/2020.
The S&P 500 is Highly Concentrated at the Top
- The outperformance of FANMAG stocks means concentration within the index has soared to record highs. The top 10 stocks in the S&P 500 make up a record 28% of the total market cap of the index.
- The top names in the index have constantly changed throughout history. Back in the 1980s, oil and gas companies dominated the top 10 in the S&P 500. In the late 1990s, it was technology companies that held the top position (but Microsoft is the only one still in the top 10 today). Today, the FANMAG stocks are in the pole position.
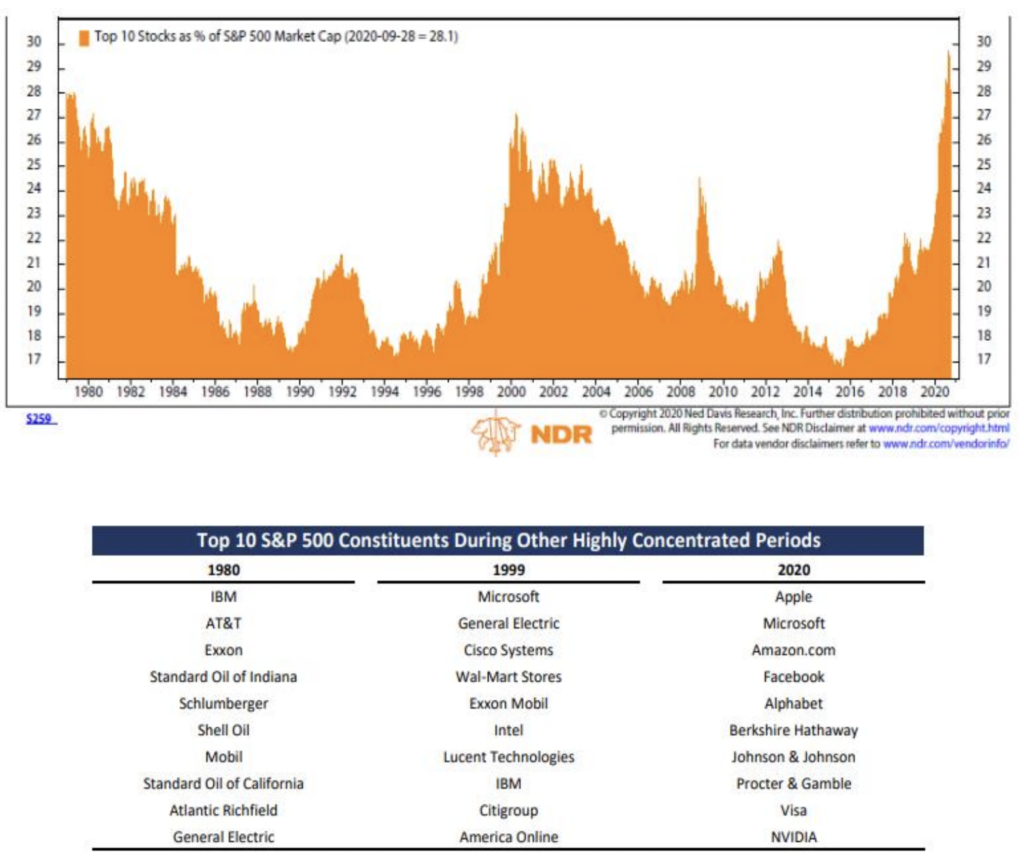
Source: Ned Davis Research. ETFdb.com and Morningstar Direct. Top names in 2020 as of 9/24/2020.
U.S. Stocks Have Risen Over the Long Run Regardless of Presidential Party
One reason for caution is election risk. There is a meaningful likelihood that we won’t know the final result of the presidential election for several days or weeks after polls close. There is also the risk of a disputed or contested election result. This uncertainty could lead to short-term fluctuations in markets.
That said, history has shown that the party in power is not a significant differentiator of investment returns. There are simply too many other factors, variables, and events that impact markets and asset prices over time.
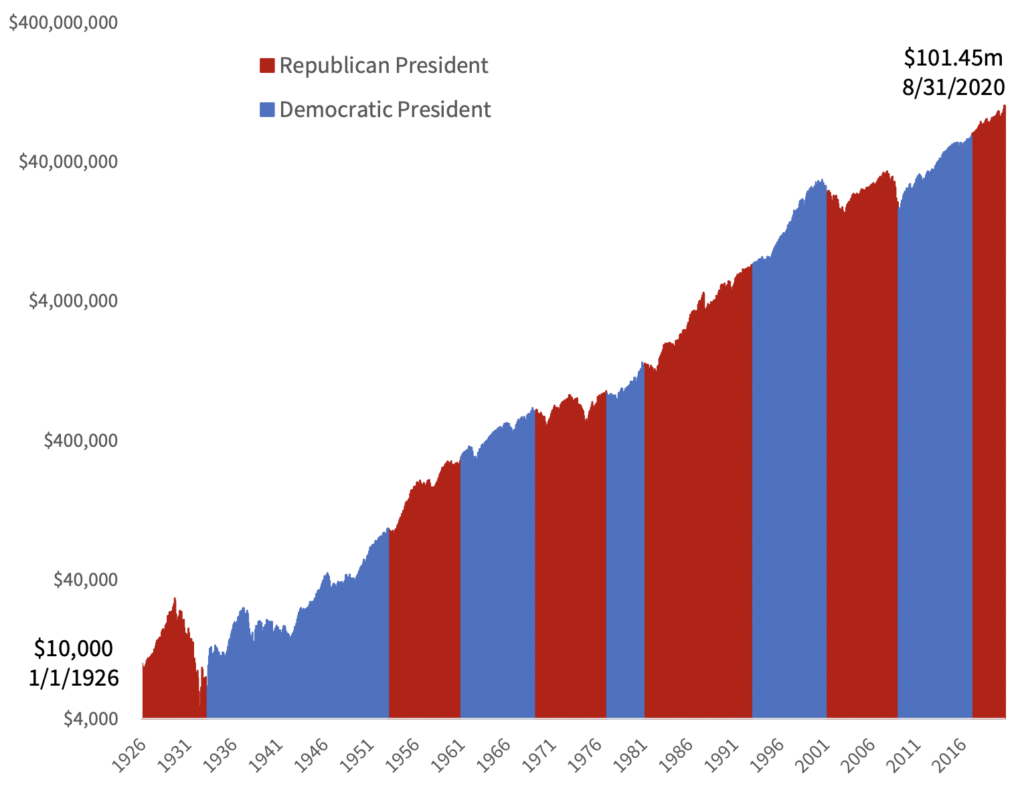
Source: Morningstar Direct. Chart concept courtesy of BlackRock. Data as of 8/31/2020.
The U.S. Budget Deficit Is Set To Balloon
The massive (and necessary) fiscal stimulus in response to the pandemic will lead to a large increase in the U.S. budget deficit.
However, the QE bond purchases by the Fed have gone a long way in offsetting (“monetizing”) the debt being issued by the Treasury to fund the massive pandemic fiscal stimulus and deficits.
These purchases have kept downward pressure on interest rates. Otherwise, the massive increase in bond supply relative to demand would likely have pushed down bond prices, increasing bond yields/interest rates, and increasing the interest expense on the federal government’s huge and growing pile of debt.
As long as rates stay below the growth rate of GDP, the government debt service cost should be manageable and the debt-to-GDP ratio sustainable.
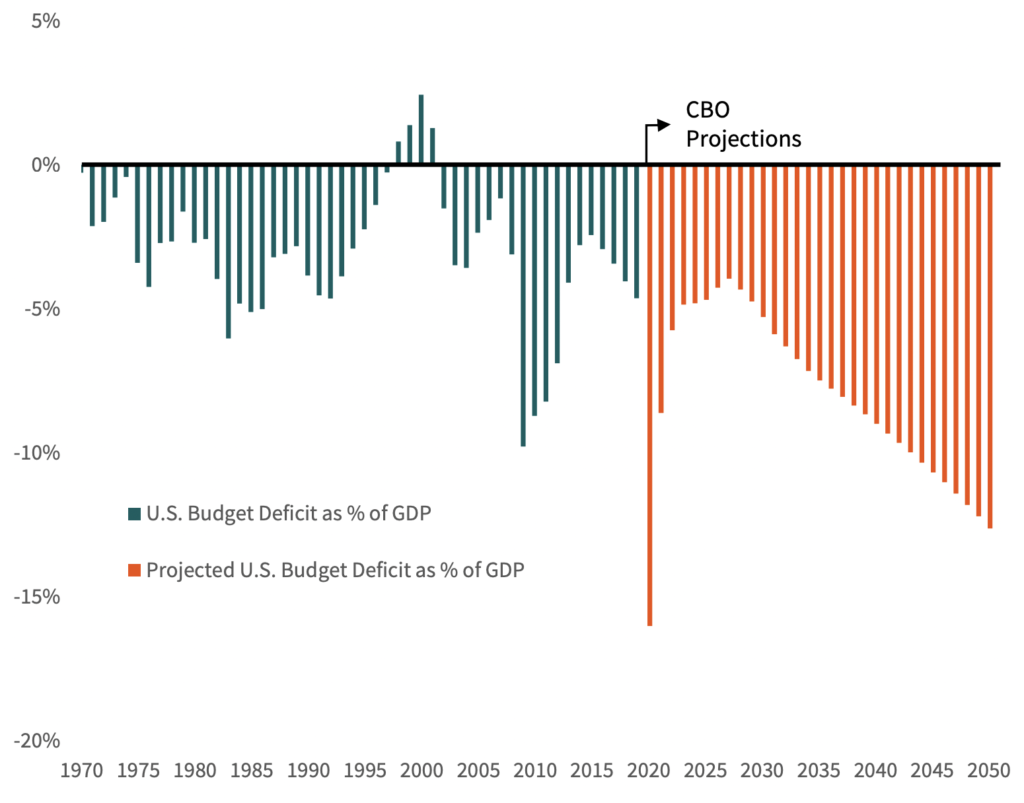
Source: Morningstar Direct. Chart concept courtesy of BlackRock. Data as of 8/31/2020.
U.S. Stocks Look Attractive Relative to U.S. Bonds
After rallying nearly 40% since their March lows, U.S. stocks are overvalued in our baseline scenario. We estimate a five-year annualized expected return for the S&P 500 of only 0.3% in our base case. So, from an absolute valuation perspective the U.S. market is expensive.
However, because core bond yields are extremely low, stock valuations—despite being absolutely high—still look relatively attractive compared to core bonds.
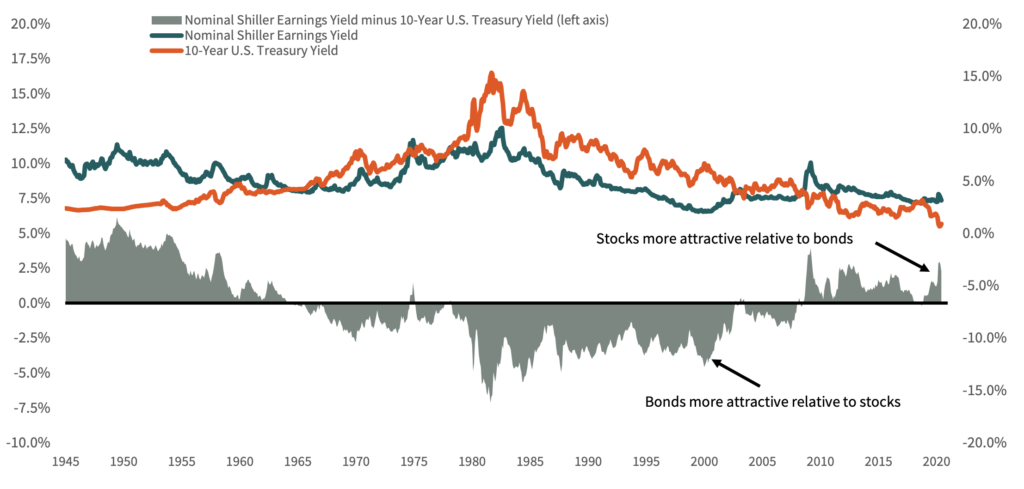
5 Source: Robert Shiller; Litman Gregory. Data as of 6/9/2020.
Growth Stocks Have Massively Outperformed Value Stocks
The FANMAG stock dominance in the S&P 500 has further increased the divide between growth and value stocks.
The six FANMAG stocks are nearing a 40% weight in the Russell 1000 Growth Index, whereas the Russell 1000 Value Index is much more diversified with forty stocks making up the top 40%.
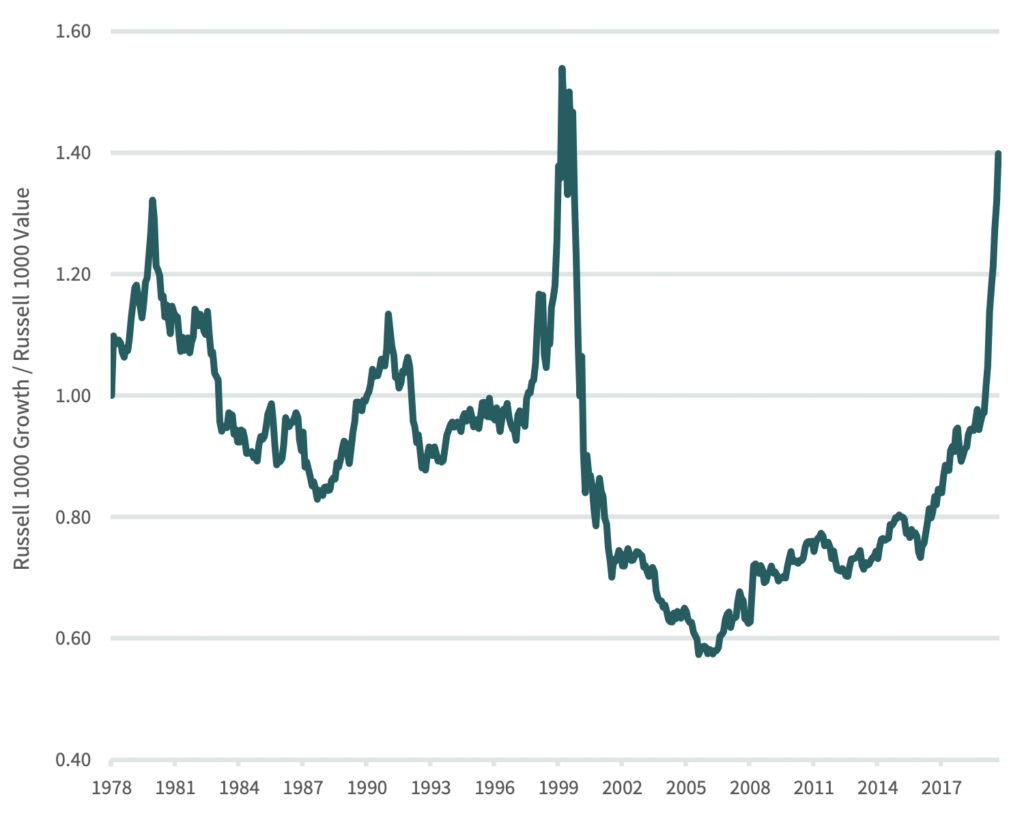
Source: Morningstar Direct. Data as of 8/31/2020.
The U.S. Dollar is Overvalued
Since 2011, the U.S. dollar has appreciated more than 35% versus a trade-weighted currency basket. This has been a headwind for U.S. dollar–based investors in foreign stocks.
After appreciating over the past nine years, the dollar now looks overvalued relative to other currencies.
One reason this may end is the extremely accommodative monetary policy in the United States, with the Fed recently cutting rates to near-zero and restarting massive quantitative easing asset purchases. What was once a large interest rate advantage for the dollar compared to lower rates in other developed countries is no longer the case.
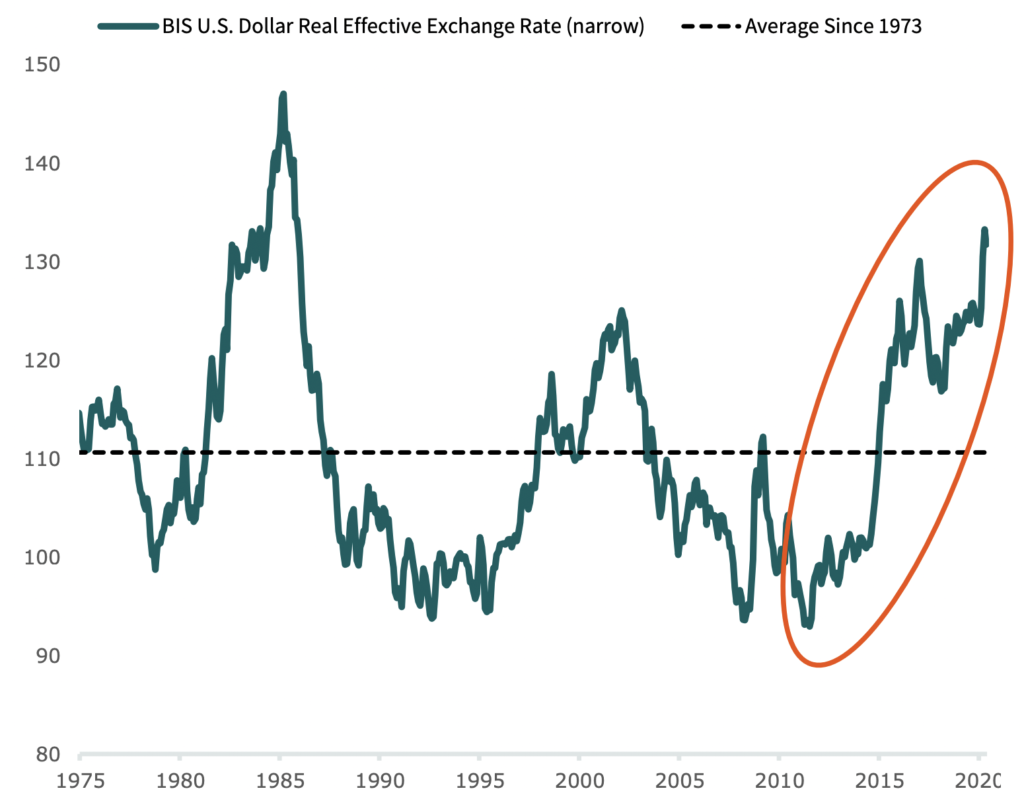
Source: Bank of International Settlements. Data as of 5/31/2020.
U.S. Treasury Rates Have Hit Generational Lows
The 10-Year U.S. Treasury Rate closed at 0.54% on March 9, 2020.
Not only was this an all-time low, but other key rates such as the 90-day and 30-year closed below 1% on March 9.
This marked the first time in history that the entire yield curve (U.S. Treasuries of all maturities) fell below 1%.
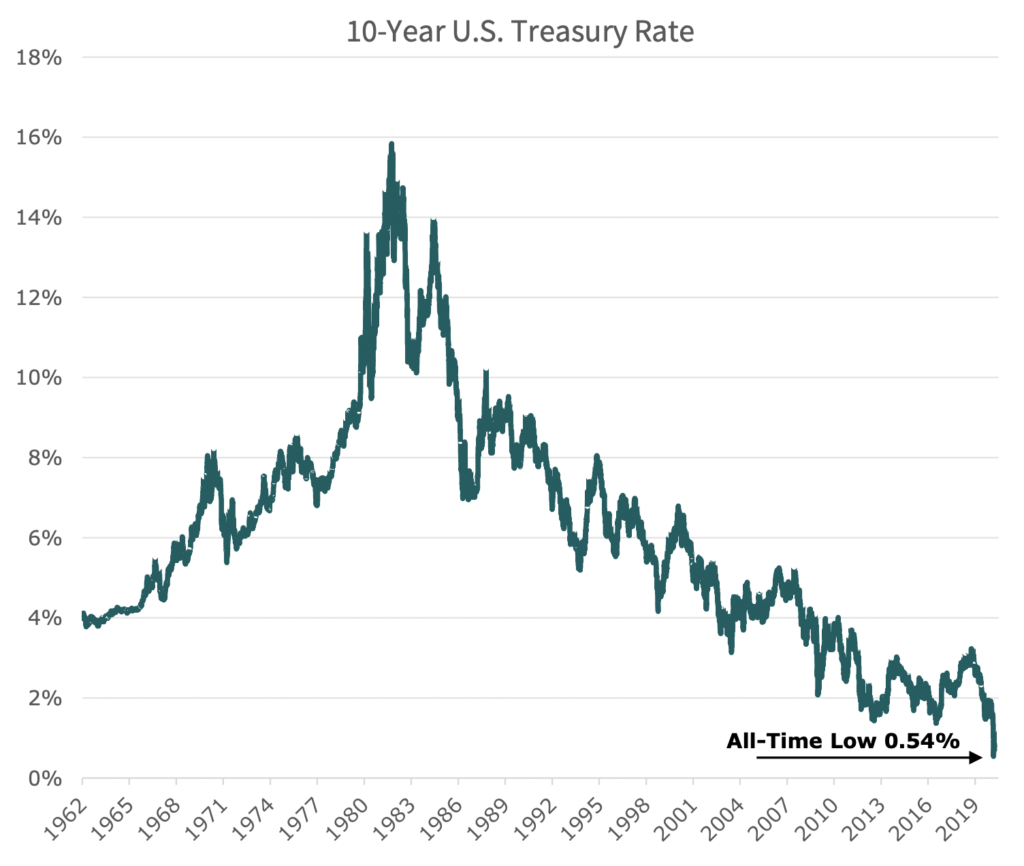
Source: Board of Governors of the Federal Reserve. Data as of 3/31/2020.
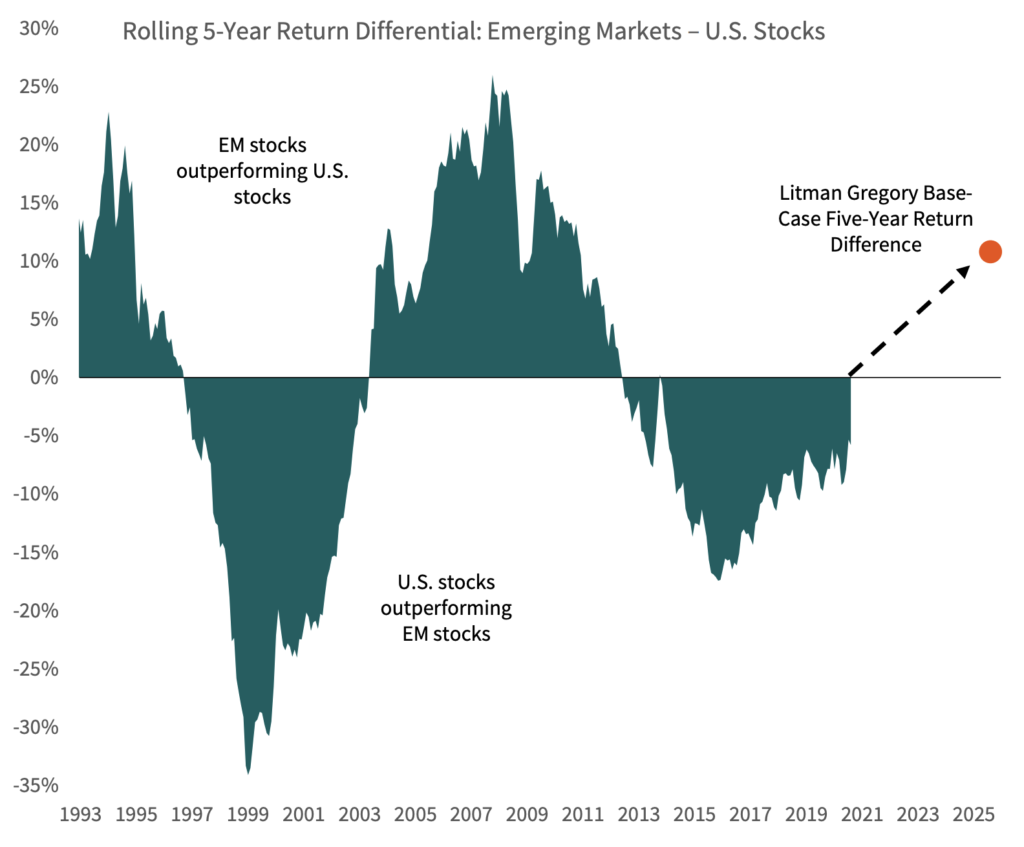
The Outlook for Emerging-Market Stocks vs. U.S. Stocks Is Attractive
Based on our analysis, emerging-market stocks have much higher five-year expected returns than U.S. stocks.
As illustrated earlier, U.S. stocks are historically overvalued by some metrics, while emergingmarket stocks are attractive on both absolute and relative valuation measures.
Source: : Morningstar Direct. Data as of 8/31/2020.
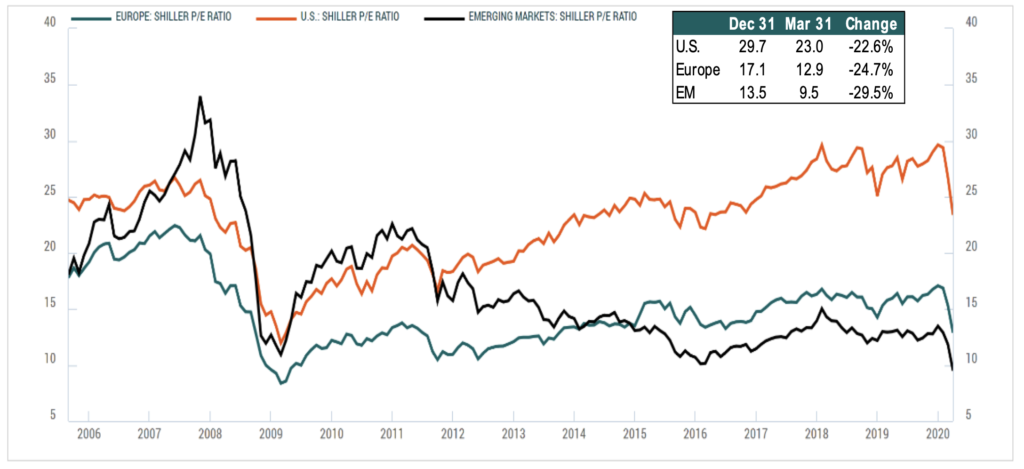
Foreign Stocks Continue to Trade at Significant Discounts to U.S. Stocks
Prior to the recent market moves in response to the coronavirus pandemic, foreign stocks were already trading at a significant discount compared to U.S. stocks. This discount has grown, in part due to the U.S. dollar strength seen in the risk selloff.
The U.S. Dollar Index ran up in the first months of the year to its peak of 6.8% on March 23 before declining in the final week of the quarter in response to the Fed announcement of unlimited asset purchases and Congress passing the largest aid package in history-ending the quarter with a gain of 2.8%.
10 Source: BCA Research Data
The Long-Term Case for Global Equity Exposure
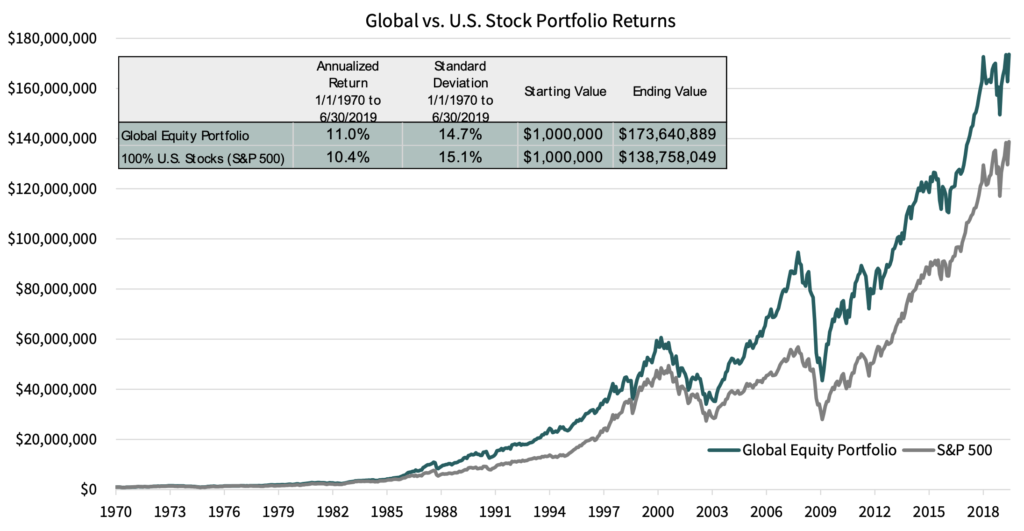
Source: Morningstar. Data as of 6/30/2019. Note: From 1970 to 1987 global equity portfolio is 60% S&P 500 and 40% MSCI EAFE. From 1988 onwards portfolio is 60% S&P 500, 20% MSCI EAFE, and 20% MSCI Emerging Markets.
Markets Have Been Resilient Despite a Myriad of Things to Worry About
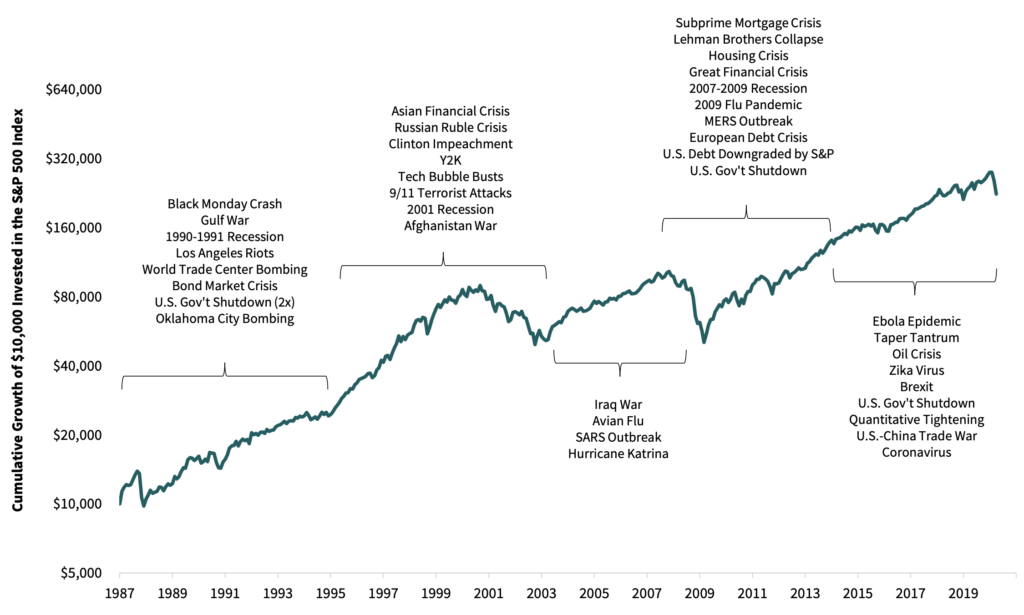
12 Source: Morningstar Direct. Data as of 3/31/2020.