Market Review
- After a very difficult first half of the year, equity markets rebounded in July and August on investor hopes of an easing in inflation and a Fed pivot or pause. The reprieve was short-lived however, as stocks tumbled to fresh lows in late September amid further aggressive central bank rate hikes and statements of further tightening to come.
- Foreign equity market returns for U.S. dollar-based investors were worsened by the sharp appreciation of the dollar. The U.S. Dollar Index was up 7.1% for the quarter and a stunning 17.3% on the year, hitting a 20-year high. These dollar gains translate into roughly comparable losses for U.S. dollar-based investors investing in international equity markets,
- The 10-year Treasury yield hit a decade high of 3.97% causing the Bloomberg U.S. Aggregate Bond Index to drop 4.8% for the quarter and 14.6% for the year to date. The losses in stocks and bonds has produced the worst start to a year for a 60/40 portfolio since 1974 and the third worst since 1926.
- Managed futures (SG Trend Index) were the standout performers once again, posting 5% gains in the quarter and 35% returns year to date.
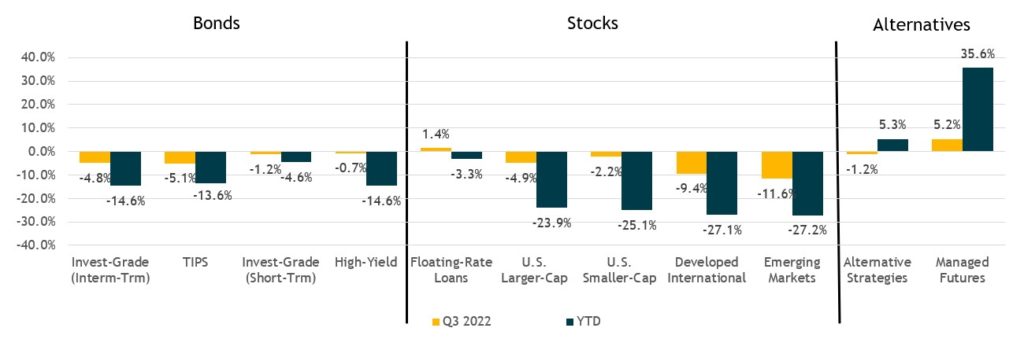
Performance reflects index returns as follows (left to right): Bloomberg US Aggregate, Bloomberg US TIPS, Bloomberg US Corporate 1 – 3Y, ICE BofA US High Yield, S&P 500, Russell 2000, MSCI EAFE, MSCI EM, HFRX Global Hedge Fund, Dow Jones Credit Suisse Hedge Managed Futures. Source: Morningstar Direct. Data as of 6/30/2022.
One of the Worst Years for Traditional 60/40 Portfolio in last 100 years
- A traditional U.S. 60/40 balanced portfolio was down 20% in the first 9 months of 2022
- Only two calendar years, both during the Great Depression have been worse.
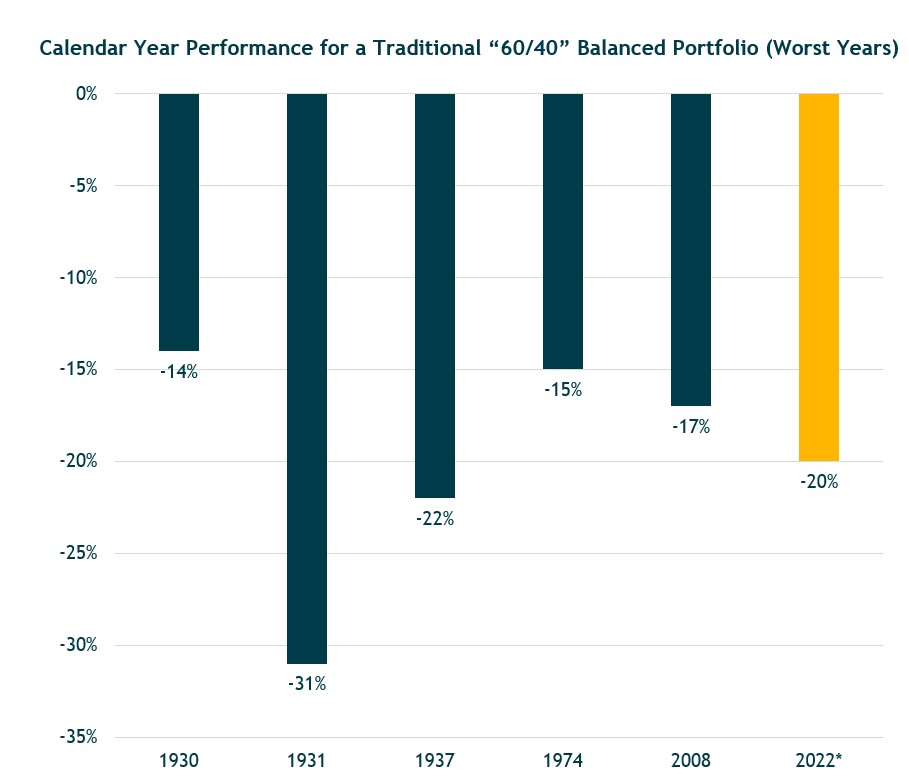
60/40 Portfolio is 60% S&P 500 Index and 40% Bloomberg US Aggregate Bond Index. *2022 is partial year through 9/30/22.
Short-Term Inflation Expectations Are High But Longer-Term Expectations Remain Within the Fed’s Target Range (So Far)
- Not all inflation indicators are negative. Consumer surveys and market-based inflation measures suggest medium-to-long-term inflation expectations remain well-anchored, consistent with the Fed ultimately achieving its 2% core inflation objective.
- Inflation expectations are crucial, because if they become unmoored, they can feed into a self-perpetuating, inflationary wage-price spiral, where wage and price hikes feed back into higher inflationary expectations, which feed into further wage and price hikes, etc.
- One huge difference (among many) between now and the 1970s is that medium-to-longer term inflation expectations reached double-digits in Volcker’s time – requiring a double-digit fed funds rate to ultimately crush inflation — versus their 2-3% range today.
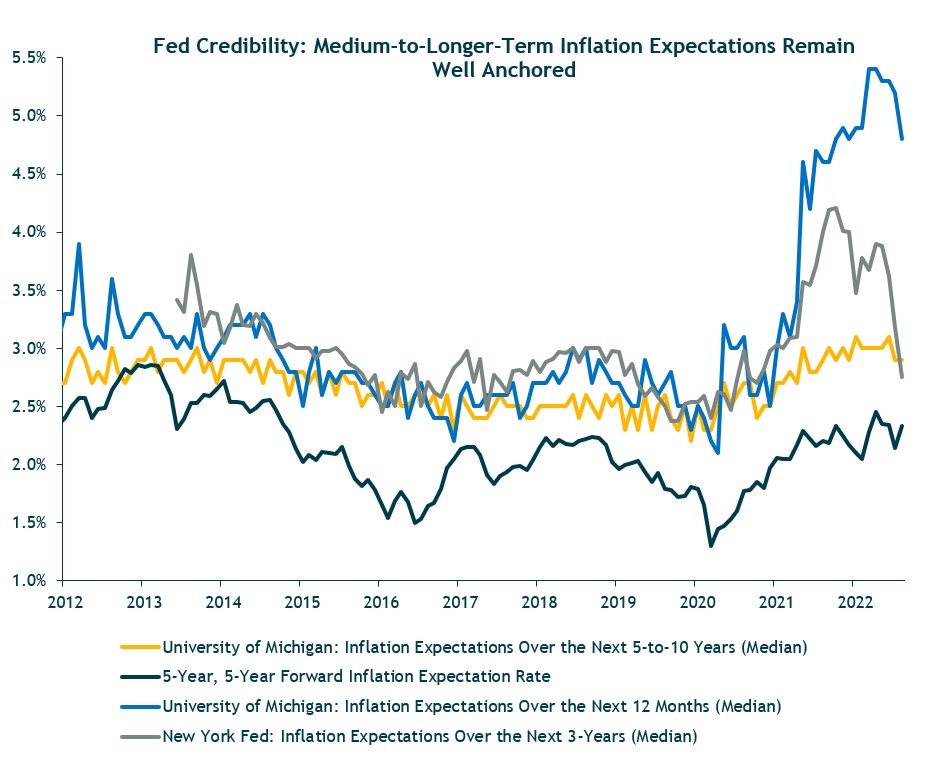
Source: Federal Reserve Bank of St. Louis, Federal Reserve Bank of New York and University of Michigan. Data as of 08/31/2022
A Sharp and Sustained Inverted Yield Curve is Another Recessionary Signal
- An inverted yield curve is unusual and usually a leading indicator of recession. But not always, and the timing from inversion to onset of recession has been highly variable.
- Nevertheless, the 2-year/10-year yield curve is strongly inverted at -50 bps. This degree of inversion has never occurred without a subsequent recession.
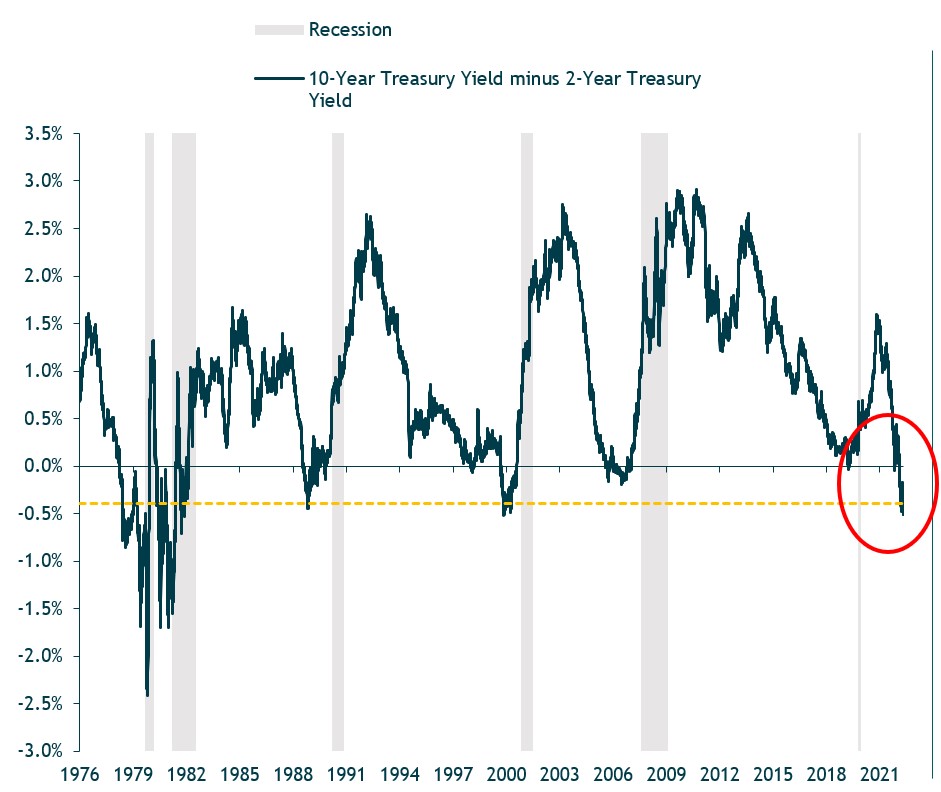
Shaded regions represent NBER-defined recessions. Source: Federal Reserve Bank of St. Louis. Data as of 9/26/2022.
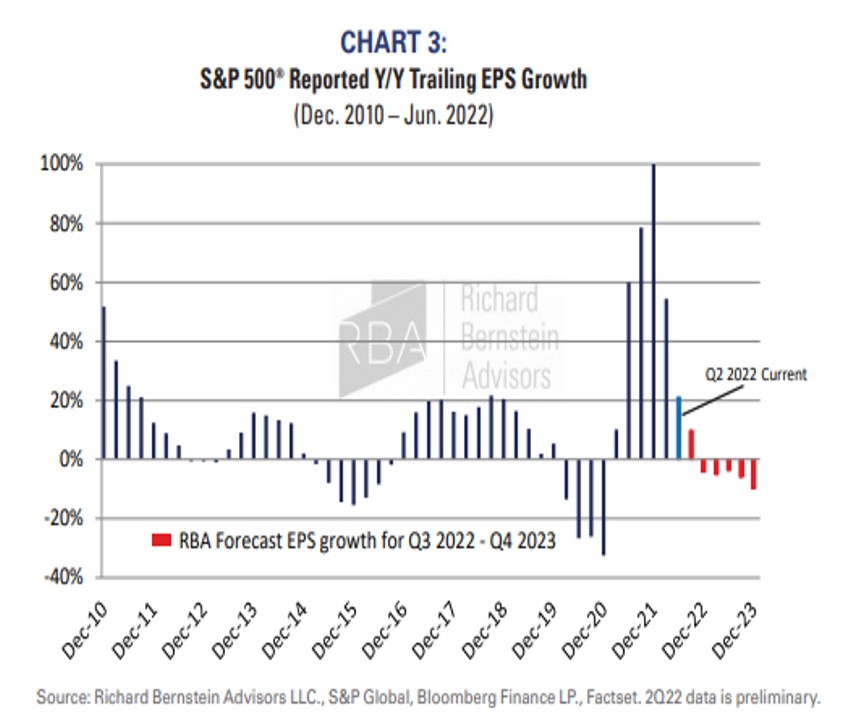
Economic Recessions are Typically Associated With a Significant Drop in Corporate Earnings Growth
- Economic recessions are typically associated with a significant drop in corporate earnings (negative EPS growth), i.e., an earnings recession.
- Historically, EPS growth typically declines anywhere from 10% to 20% during an economic recession (post WWII).
- Currently, the bottom-up consensus estimate is for an 8% increase in S&P 500 Operating EPS for 2023.
- Analyst estimates have come down recently, but the market is still far from discounting anywhere near a 10% to 20% earnings decline at its current level.
U.S. Dollar Strength Has Negatively Impacted International Equity Returns
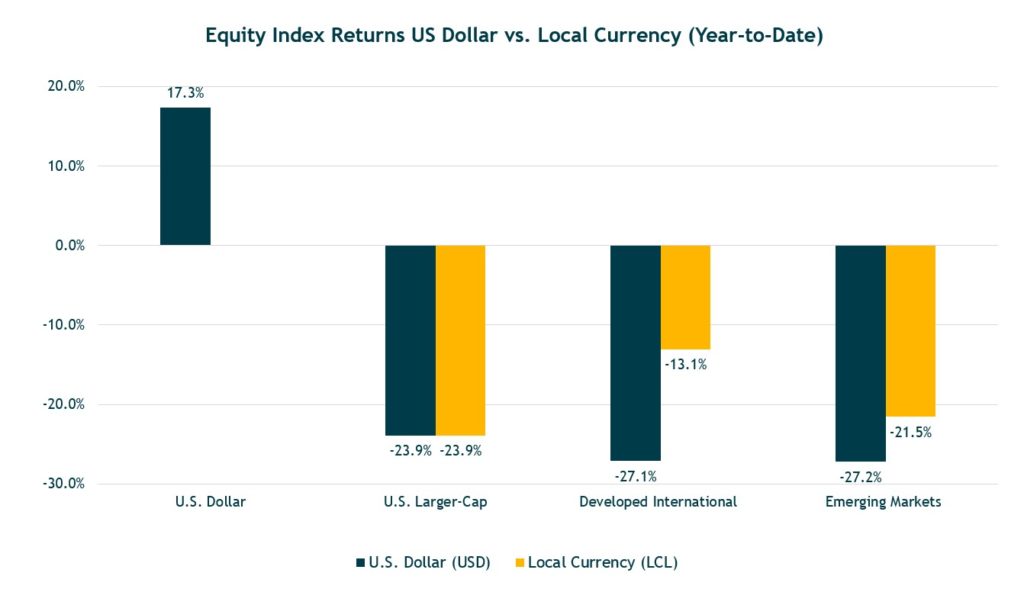
Peformance reflects index returns as follows (left to right): S&P 500, MSCI EAFE, MSCI EAFE USD Hedged, MSCI EM, MSCI EM USD Hedged. Source: Morningstar Direct. As of 9/30/2022.
What Happens After Bear Market Declines
- Historically, market declines are followed by market strength and typically grow stronger the longer the time period measured.
- This observation speaks to the importance of viewing investments over a long-time horizon.
- Note that some of the five- and 10-year performance shown in the chart overlap periods, but the results reflect what an investor experienced following the 20%-plus market drop.
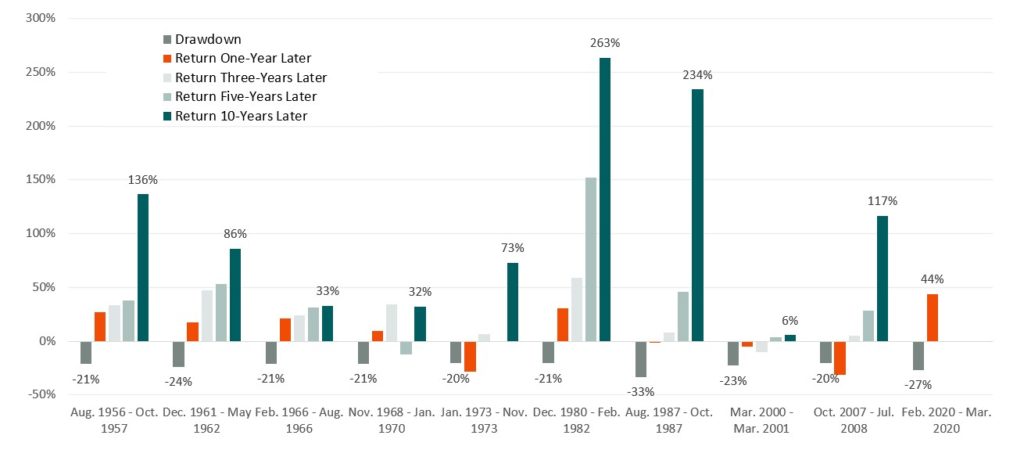
Bear Market (decline of 20% of more from previous high). Source: Morningstar Direct.
Owning/Buying U.S. Stocks After a 25% Market Decline Typically Pays Off for Longer-Term Investors
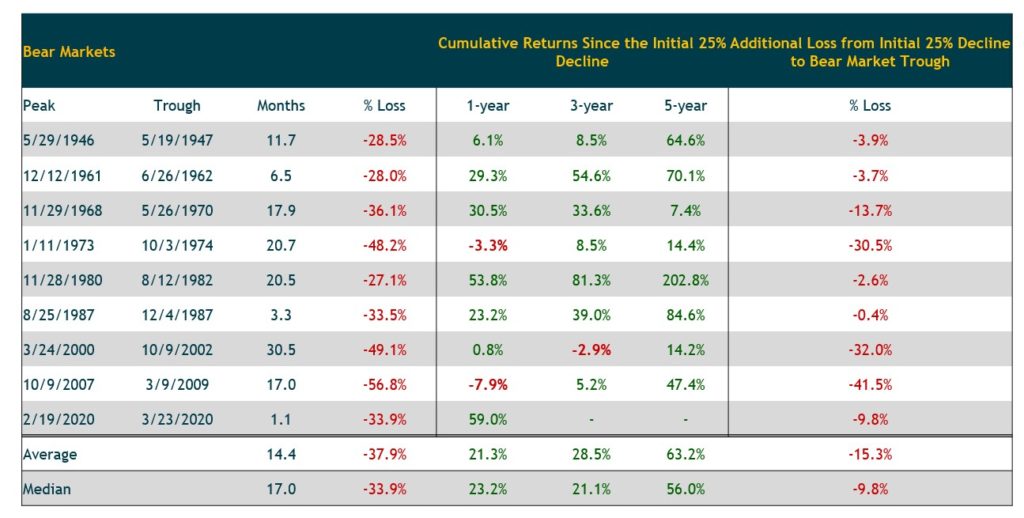
Source: Morningstar Direct. Data as of 9/30/2022.
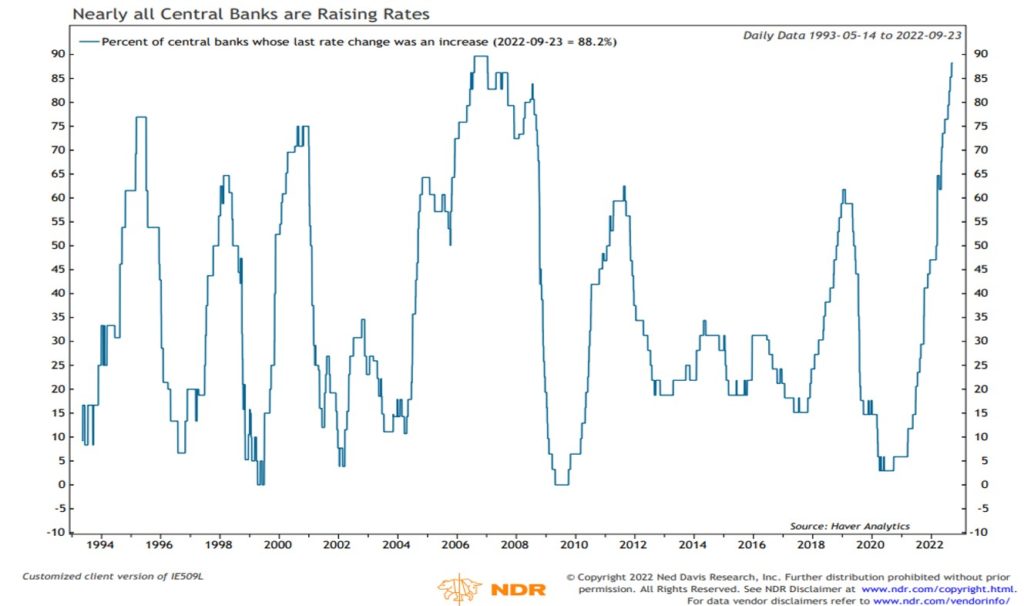
Nearly All Global Central Banks are Raising Rates
Rising Rates Have Hurt Bond Returns but Should Result in Higher Yields and Better Expected Returns
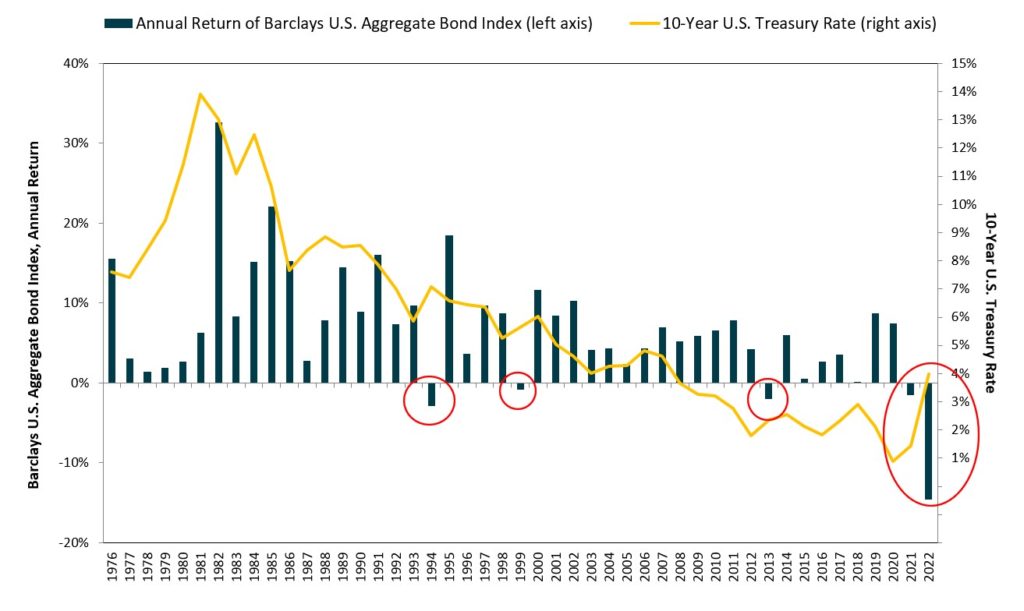
Source: Morningstar / Federal Reserve. Data as of 9/30/2022.