Market Review
- The S&P 500 reached a 2023 high at the end of July, but from its intra-quarter high the index declined 6.3% through the end of September. Smaller-cap stocks (Russell 2000) also had momentum early in the quarter but changed course and ended the quarter down 5.1%.
- Within foreign markets, developed international stocks (MSCI EAFE) declined 4.1% in the quarter, while emerging market stocks (MSCI EM) fell 2.9%. The U.S. dollar (DXY Index) surged over 3% during the quarter, resulting in a headwind for foreign markets.
- The 10-year Treasury yield climbed nearly 70bps in the quarter, ending the period with a 4.59% yield. As a result, core bonds (Bloomberg U.S. Aggregate Bond Index) fell 3.2% in the quarter. High-yield bonds (ICE BofA US High Yield) managed to eke out a small quarterly gain and are up 6% year-to-date.
- Managed futures demonstrated their diversification benefits gaining 1.2% for the quarter, while stocks (S&P 500) and bonds (Bloomberg US Aggregate) both ended in negative territory.
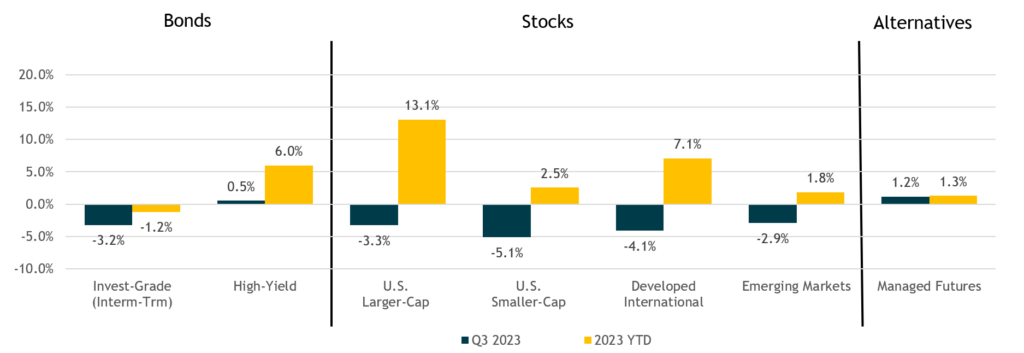
Performance reflects index returns as follows (left to right): Bloomberg US Aggregate, ICE BofA US High Yield, S&P 500, Russell 2000, MSCI EAFE, MSCI EM, Morningstar US Fund Multistrategy Index, SG Trend Index. Source: Morningstar Direct. Data as of 9/30/2023.
S&P 500 Year-to-Date Sector Performance
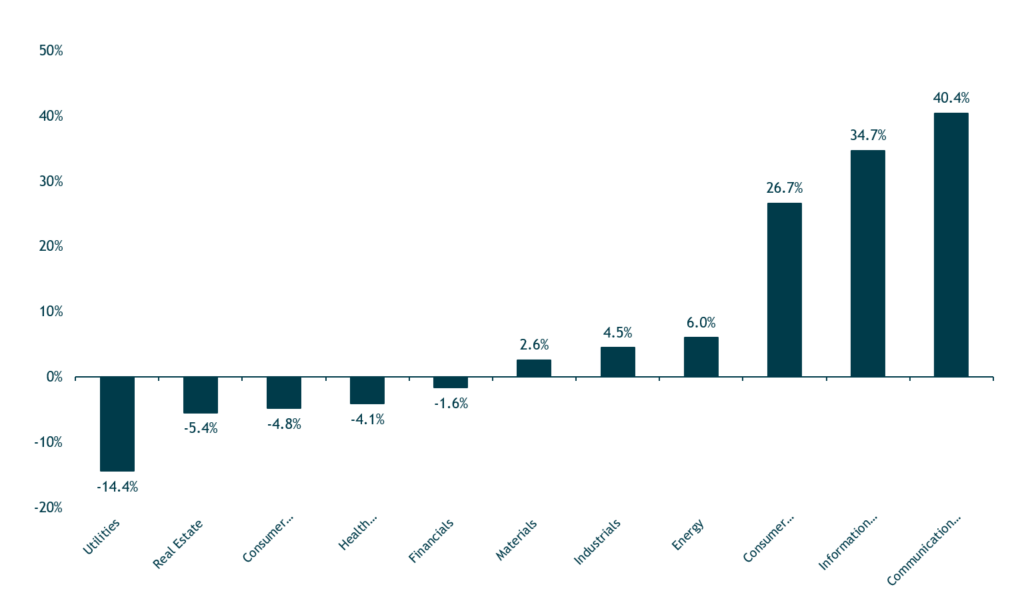
Source: Morningstar Direct. Data as of 9/30/2023.
S&P 500 Performance Continues to be Driven by the “Magnificent Seven”
- Stock market gains have remained unusually narrow, with the seven largest stocks in the index leading the way.
- The “Magnificent Seven” stocks – Alphabet (Google), Amazon, Apple, Meta (Facebook), Microsoft, Nvidia, and Tesla account for most of the year-to-date returns of the S&P 500.
- The remaining 493 stocks in the S&P 500 are roughly flat year-to-date.
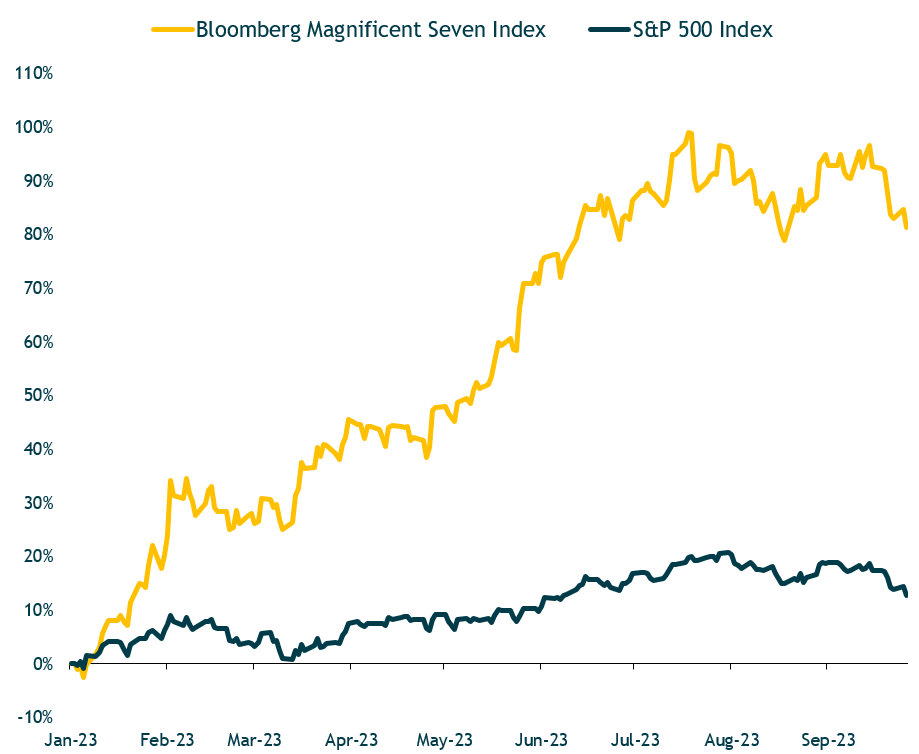
Source: Bloomberg LP. Data as of 9/26/2023. Magnificent Seven stocks: Alphabet, Amazon.com, Apple, Meta Platforms, Microsoft, Nvidia, Tesla.
Inflation Has Declined Towards the Fed’s 2% Goal
- This chart illustrates the year-over-year inflation and year-over-year inflation excluding shelter costs, which is a key CPI input.
- While year-over-year inflation recently came in at 3.7%, this number drops to 1.97% when excluding shelter.
- In late September, the Fed paused their rate hiking cycle but indicated there could be more hikes this year if inflation reaccelerates.
- Projections released in the Fed’s dot plot showed the likelihood of one more 25bps increase at the November 1 meeting, then two cuts in 2024.
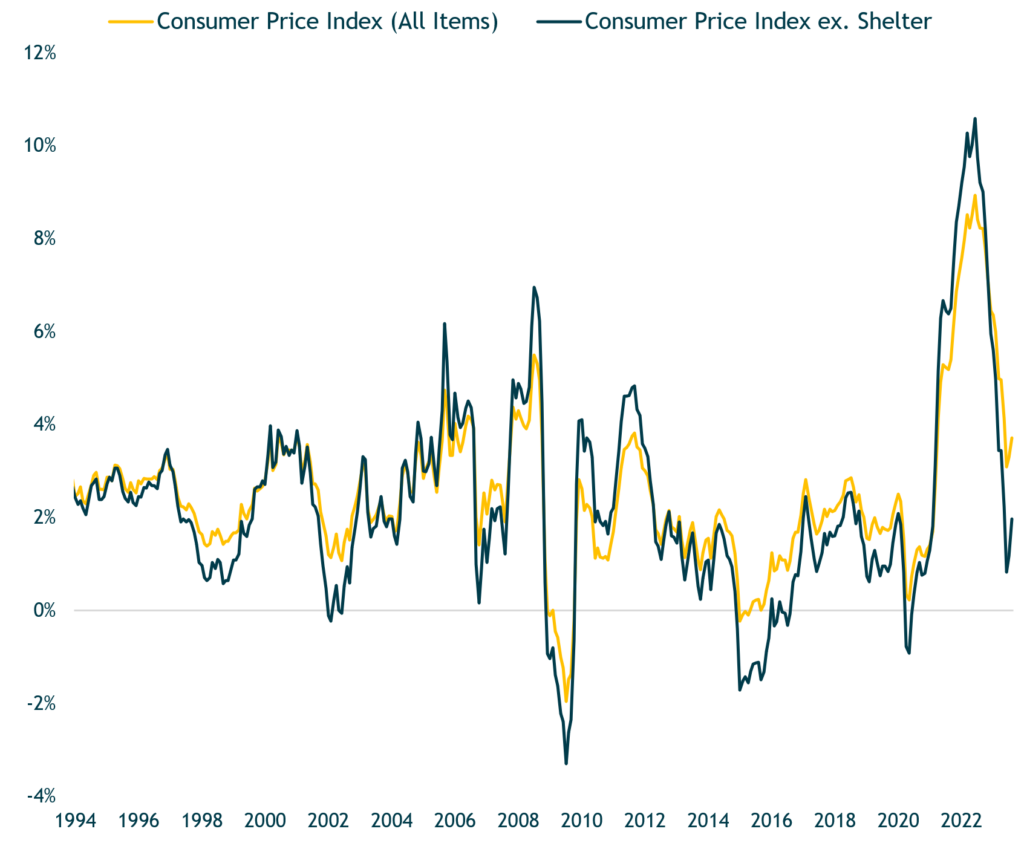
Source: U.S. Bureau of Labor Statistics. Data as of 8/31/2023.
Equity Returns Following a Fed Tightening Cycle are Mixed Depending on the Inflation Environment
- Equity returns following the end of a tightening cycle have differed depending on the inflation environment:
- Most of the negative outcomes occurred during bouts of elevated inflation (particularly through the 60’s and 70’s). Because of higher inflation, the Fed will typically maintain a more restrictive policy – i.e., it will take them longer to pivot and cut rates (higher for longer).
- When inflation is not elevated, the Fed can move to a more accommodative stance much sooner. This can be seen in the post 1980’s in terms of the much shorter time between the final rate hike and the subsequent rate cut.
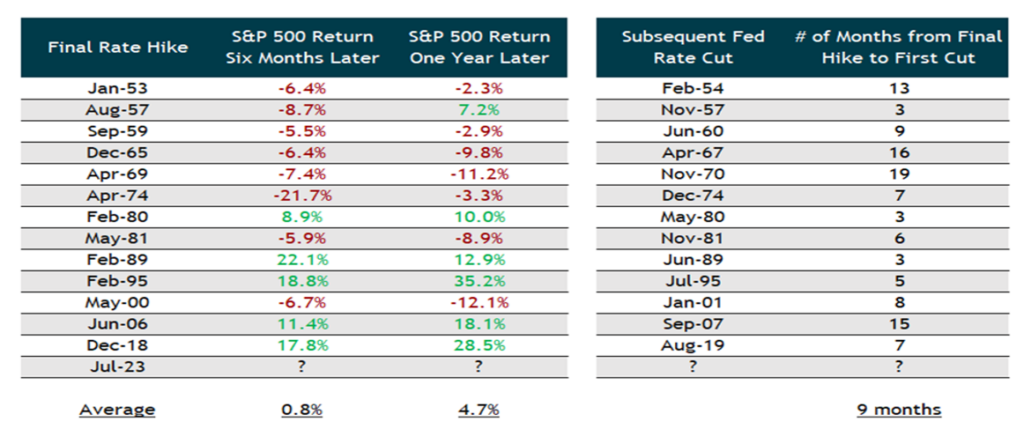
Source: iM Global Partner and Board of Governors of the Federal Reserve System. Data as of 9/30/2023. S&P 500 Index price returns shown.
Foreign Stock Valuations Remain Attractive Relative to U.S. Stocks
- We continue to tactically favor EM and international stocks relative to the U.S. based on their higher expected returns over our medium-term (five year) horizon.
- Our five-year expected return estimates for developed international and emerging markets equities are high-single to low-double digit annual average returns, while we estimate low- to mid-single digit returns for the S&P 500.
- This is below our long-term “strategic” expected return for the S&P 500, in the mid-to-upper single digits. We don’t think we are being adequately compensated (in terms of expected return) for U.S. stocks’ inherent risks.

Source: Bloomberg LP. Data as of 9/20/2023.
Starting Bond Yields are Highly Correlated With 5-Year Total Returns
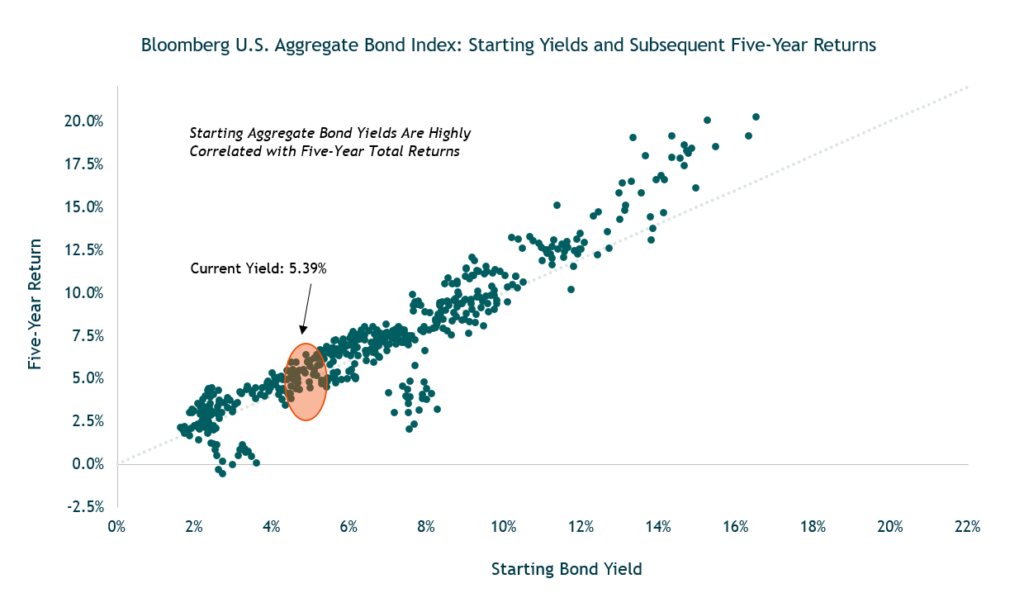
Source: Bloomberg LP. Data as of 9/30/2023.
The 10-Year Treasury Yield Climbed to Levels Not Seen in Over a Decade
- The benchmark 10-year Treasury yield climbed nearly 70bps in the third quarter, ending the period at 4.59% – levels not seen since before the financial crisis in 2008/2009.
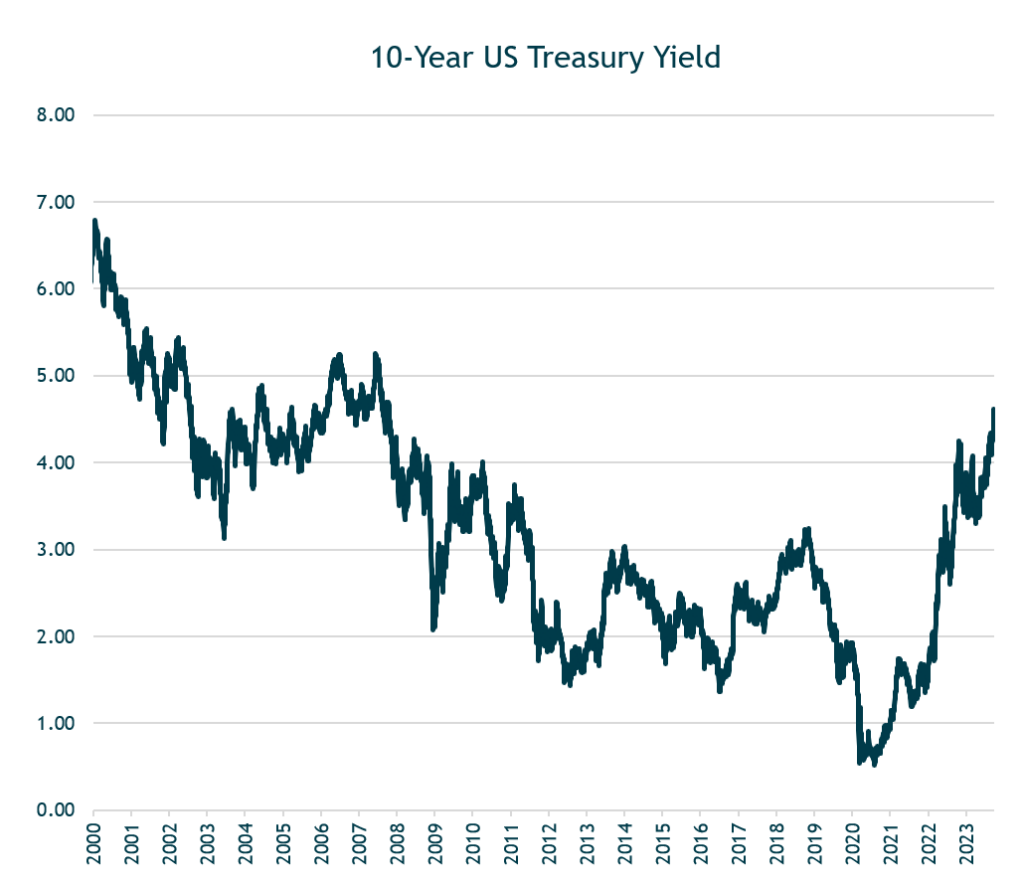
Source: Federal Reserve. Data as of 9/30/2023.
Historically, Fed Tightening Cycles Lead to Recession
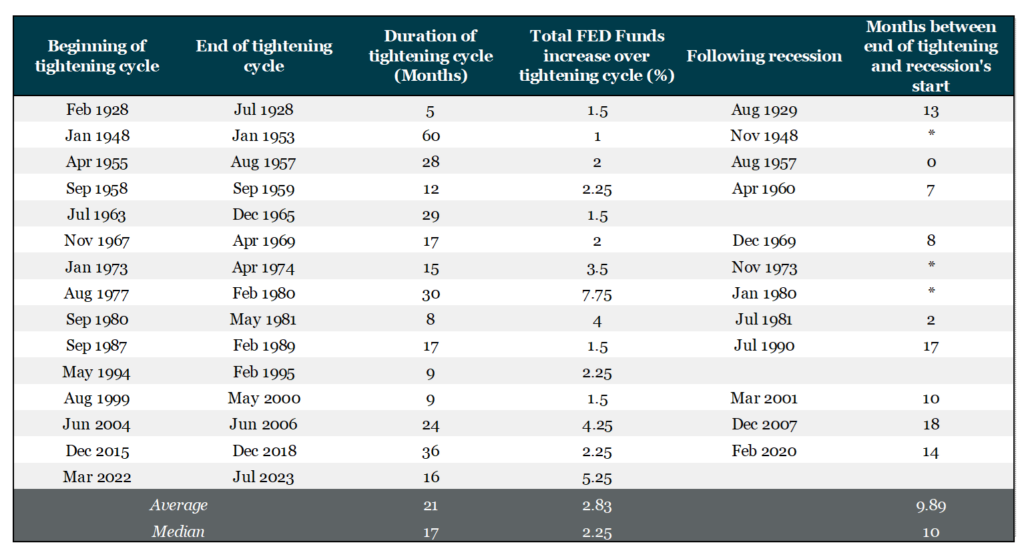
Source: Board of Governors of the Federal Reserve System, IMF, National Bureau of Economic Research (NBER).
Owning/Buying U.S. Stocks After a 25% Market Decline Typically Pays Off for Longer-Term Investors
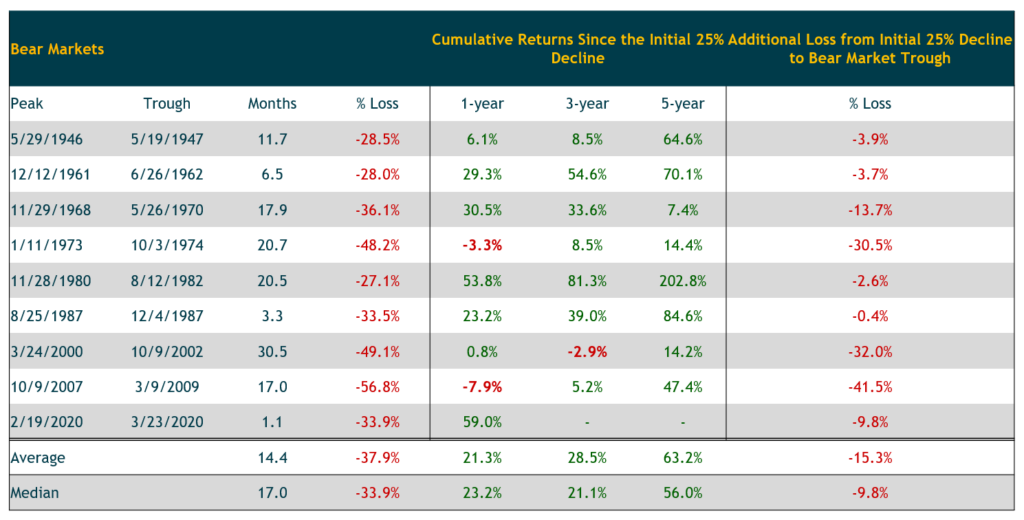
Source: Morningstar Direct. Data is for the S&P 500 Index. Data as of 9/30/2023.