Market Review
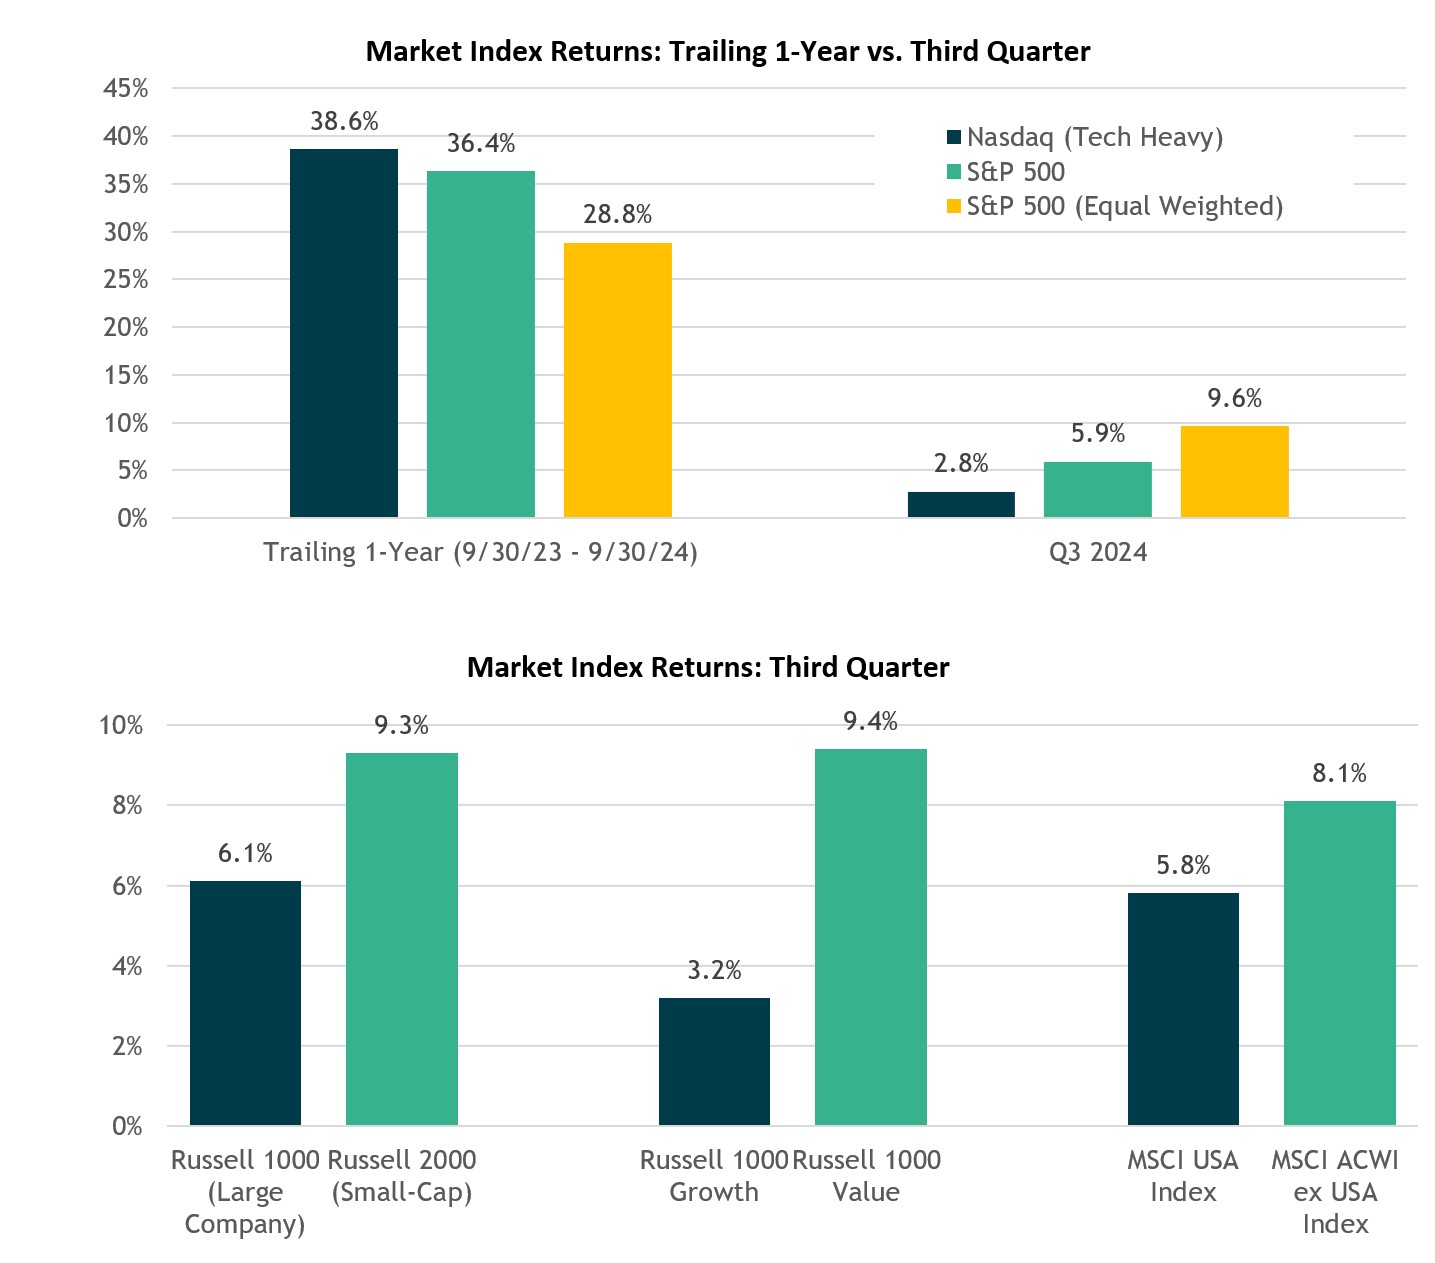
- Despite some intra-quarter volatility, U.S. Larger Cap (S&P 500 Index) reached new highs, gaining nearly 6% in Q3 pushing its year-to-date return to over 22%. Notably, there was a rotation out of large-cap growth tech stocks into a broader range of sectors and styles. U.S. Larger-cap value (Russell 1000 Value) gained 9.4% and outperformed U.S. Larger-cap growth’s (Russell 1000 Growth) 3.2% gain, while U.S. smaller-caps (Russell 2000) rose 9.3%.
- Outside of the U.S., developed international stocks (MSCI EAFE) gained 7.3%, finishing ahead of domestic stocks (S&P 500 Index) in the three-month period. Emerging markets stocks (MSCI EM Index) were relatively quiet for most of the quarter but rose sharply in the last week of the period after China announced their boldest stimulus in years. Emerging-markets stock finished the quarter up 8.7% thanks to a 23.5% gain for China (MSCI China Index) during the month of September
- Within the bond markets, returns were positive across most fixed-income segments. The benchmark 10-year Treasury yield declined from 4.36% to 3.81% amid lower inflation and recession concerns. In this environment, the Bloomberg U.S. Aggregate Bond Index gained 5.0% and credit performed well in the quarter as high-yield bonds (ICE BofA Merrill Lynch High Yield Index) were up 5.5% in the quarter.

Performance reflects index returns as follows (left to right): Bloomberg US Aggregate, ICE BofA US High Yield, S&P 500, Russell 2000, MSCI EAFE, MSCI EM, Morningstar US Fund Multistrategy Index, SG Trend Index. Source: Morningstar Direct. Data as of 9/30/2024..
The Bond Market is Pricing in Aggressive Rate Cuts
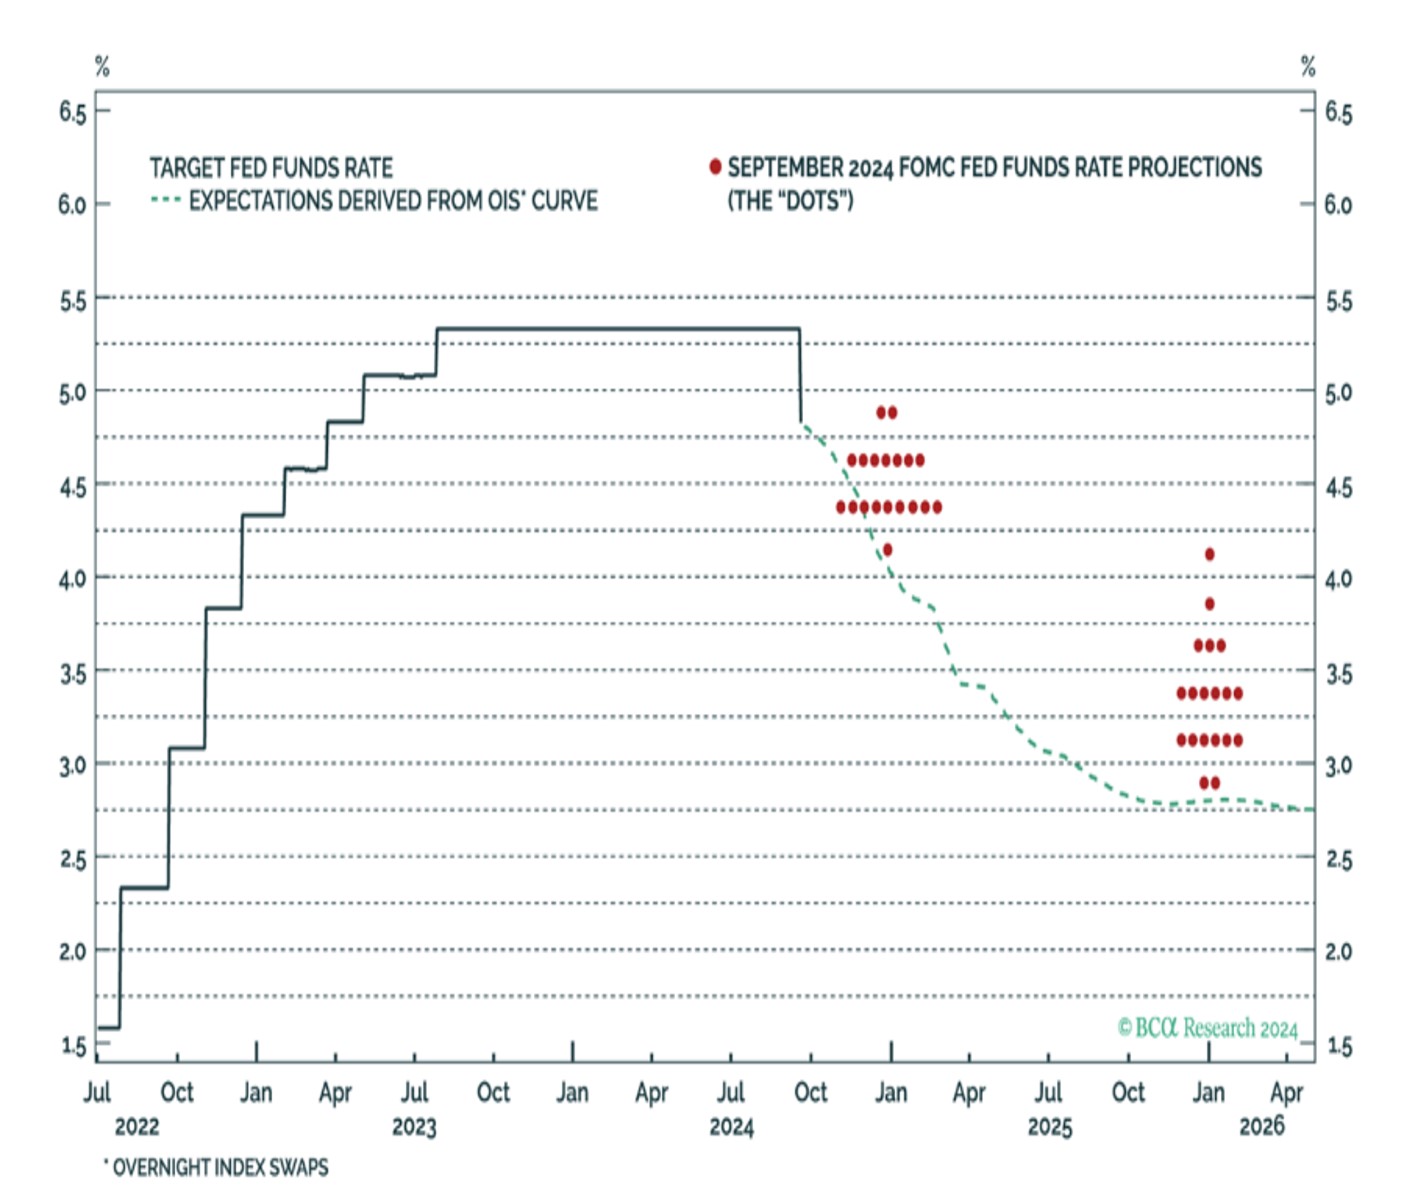
- The bond market is currently pricing in a fed funds rate of 2.7% at year-end 2025/early 2026 (see the green dashed line).
- The difference between what the bond market is pricing in, and the Fed expectations (red dots), is the market pricing in the possibility of a recession.
Source: BCA Research. Data as of 9/30/2024.
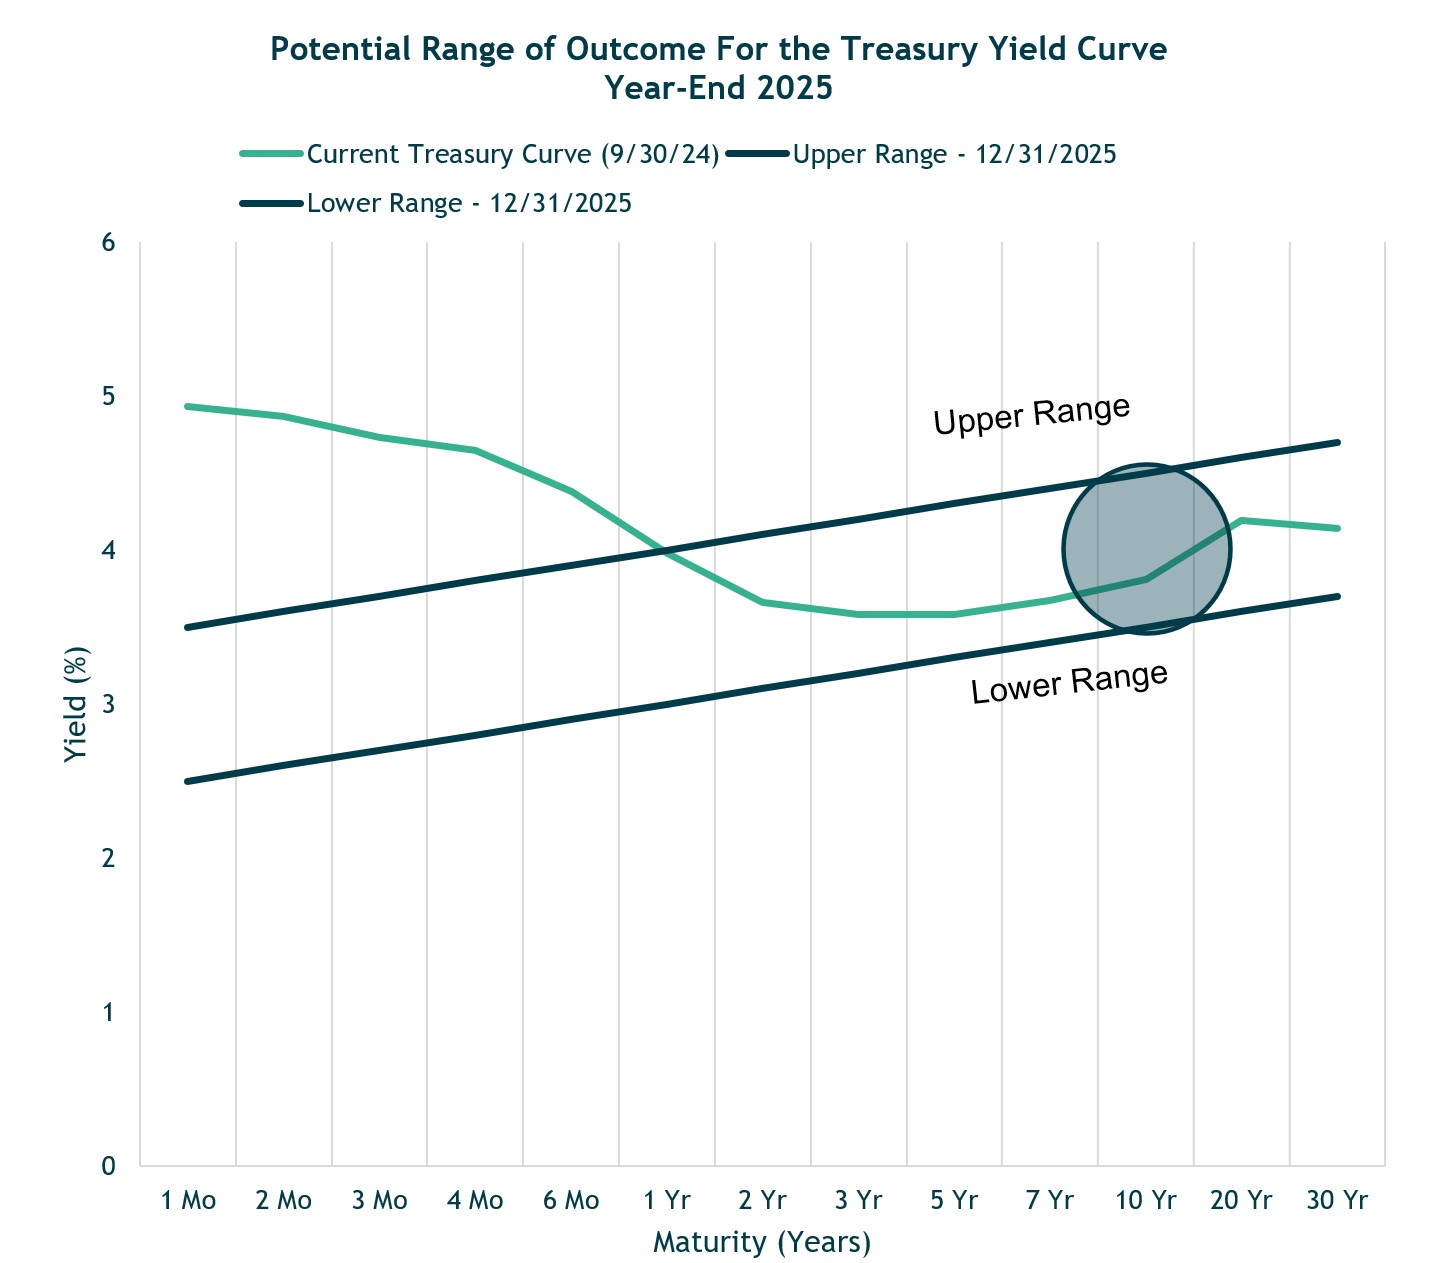
We Believe 10-Year Treasury Yields are Range Bound
- We believe 10-year Treasury yields are range bound over the next 12 to 15 months, and outside of a recession, we don’t believe there is significant benefit to owning longer-term duration bonds such as investment grade corporates or 10-year treasury notes (i.e., the Bloomberg US Agg Bond Index).
Source: US Treasury. Data as of 9/30/2024.
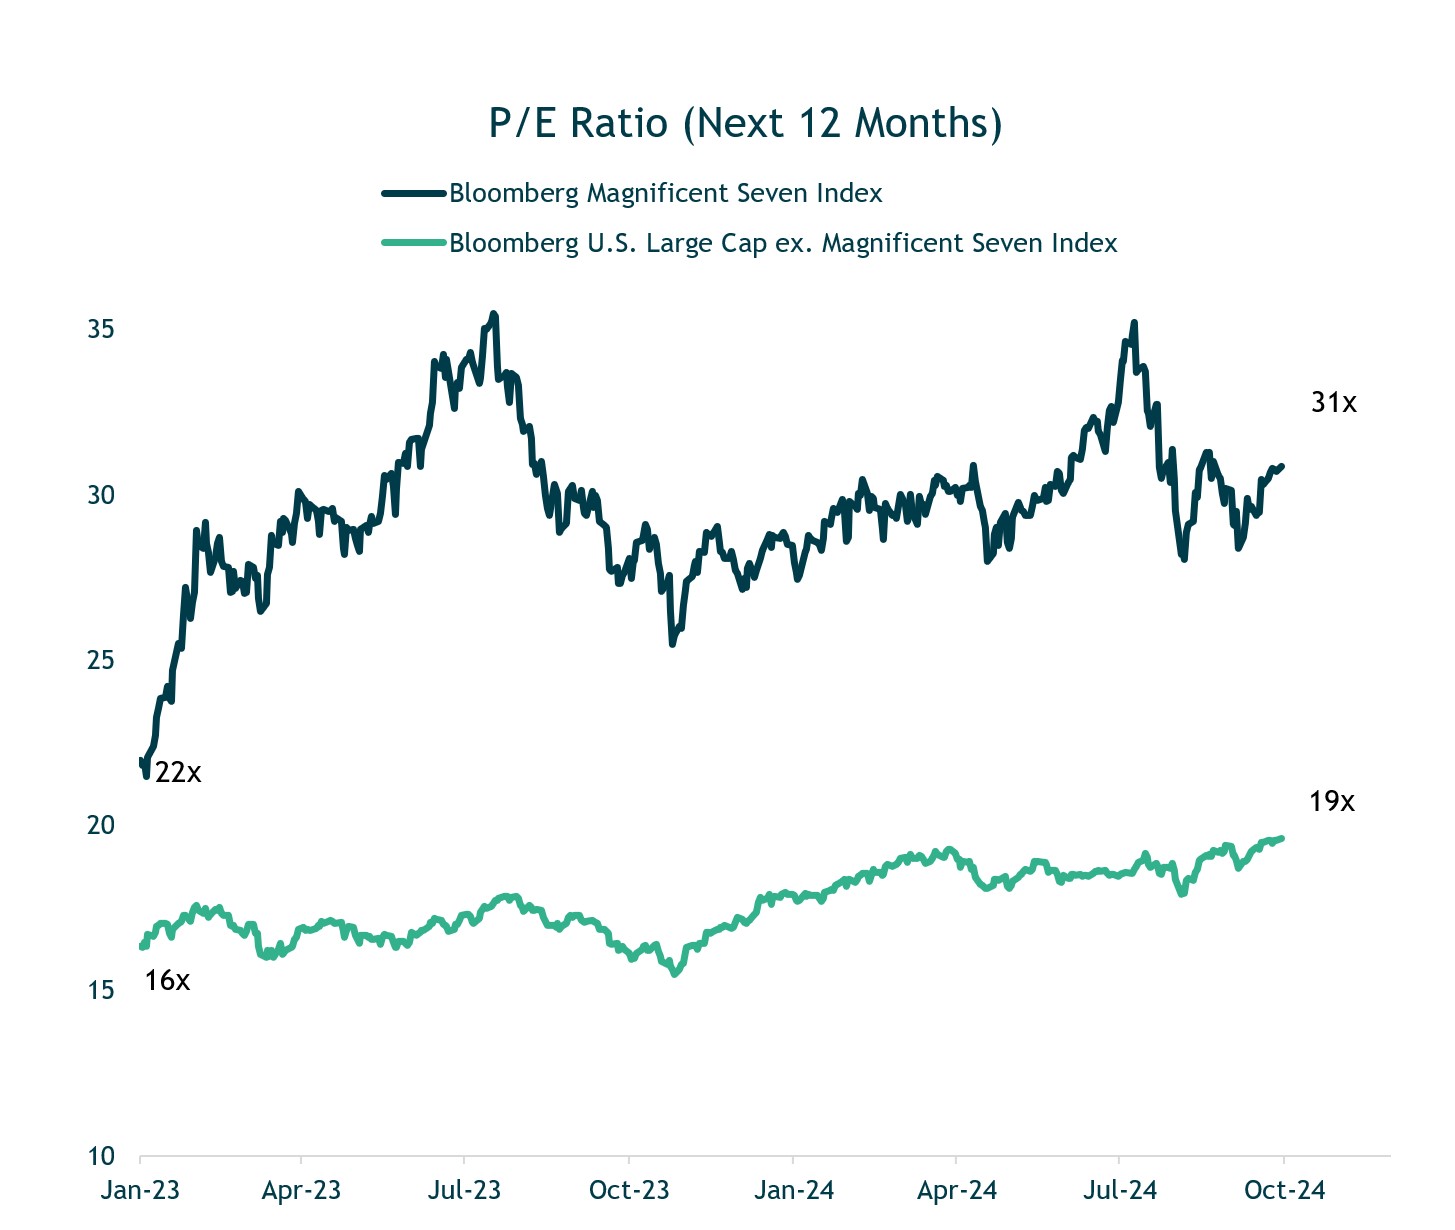
We Expect the Rally in U.S. Stocks to Broaden Out Beyond Large Cap Growth
- Our portfolios have meaningful exposure to many of these strong-performing mega-cap stocks, which has benefitted portfolio performance. But we remain balanced, also owning larger-cap value and smaller-cap U.S. stocks that are trading at more attractive valuations and offer important diversification benefits.
- In March, we rebalanced our U.S. equity allocation to increase exposure towards higher-quality, more attractively valued parts of the U.S. equity market (value stocks and smaller-cap stocks) that could benefit from an ongoing economic expansion and a broadening out of the market rally.
Source: Bloomberg LP, iM Global Partner. Chart concept courtesy of BCA Research. Data as of 9/30/2024.
Equity Market Trends Shifted in Third Quarter
- Fed’s decision to start cutting rates will likely be somewhat of a game changer we believe, shifting the market trends.
- Notably, a rotation out of large-cap growth tech stocks and into a broader range of sectors and styles occurred in the third quarter.
- Other areas of the equity market which have lagged and have lower valuations—small-cap companies, value stocks, and international markets— also benefitted from this broadening of the market in the third quarter.
S&P 500 (Equal Weight) includes the same constituents as the capitalization weighted S&P 500 Composite. Source: Morningstar Direct. As of 9/30/2024.
U.S. Stock Market Performance Around Presidential Elections
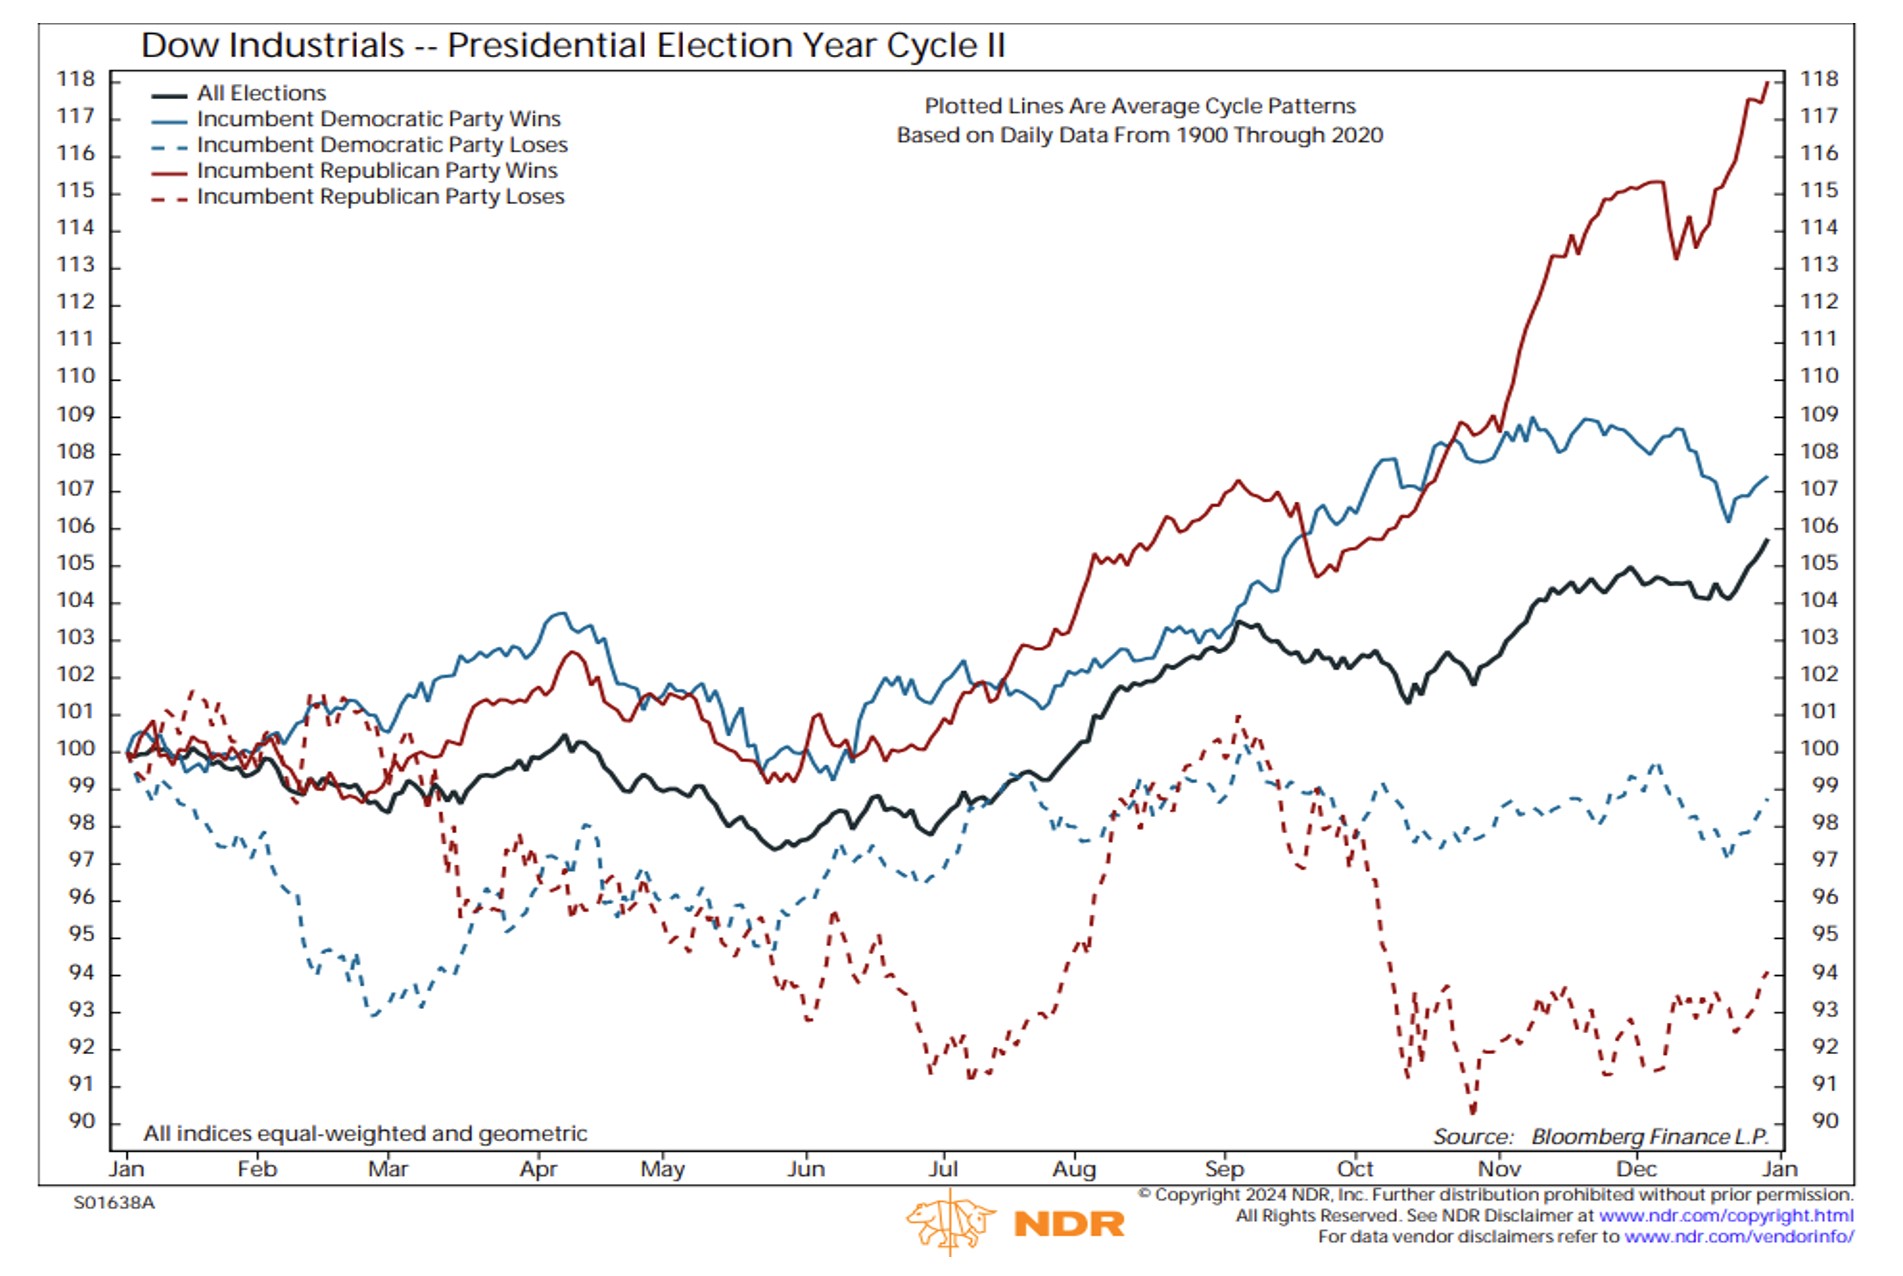
The Election Will Likely Bring Volatility, but Historically Stocks Have Trended Higher
- With the U.S. presidential election one month away, we want to reiterate our long-held view that portfolio positioning should be guided by an analysis of longer-term risks and rewards, not election outcomes.
- We recognize that it’s natural for investors on both sides of the aisle—especially in today’s polarized environment—to believe that an election outcome could have a big impact on the financial markets.
- This intuition, however, is not supported by the historical data and we provide some evidence below that stocks have historically trended higher regardless of the political party of the President.
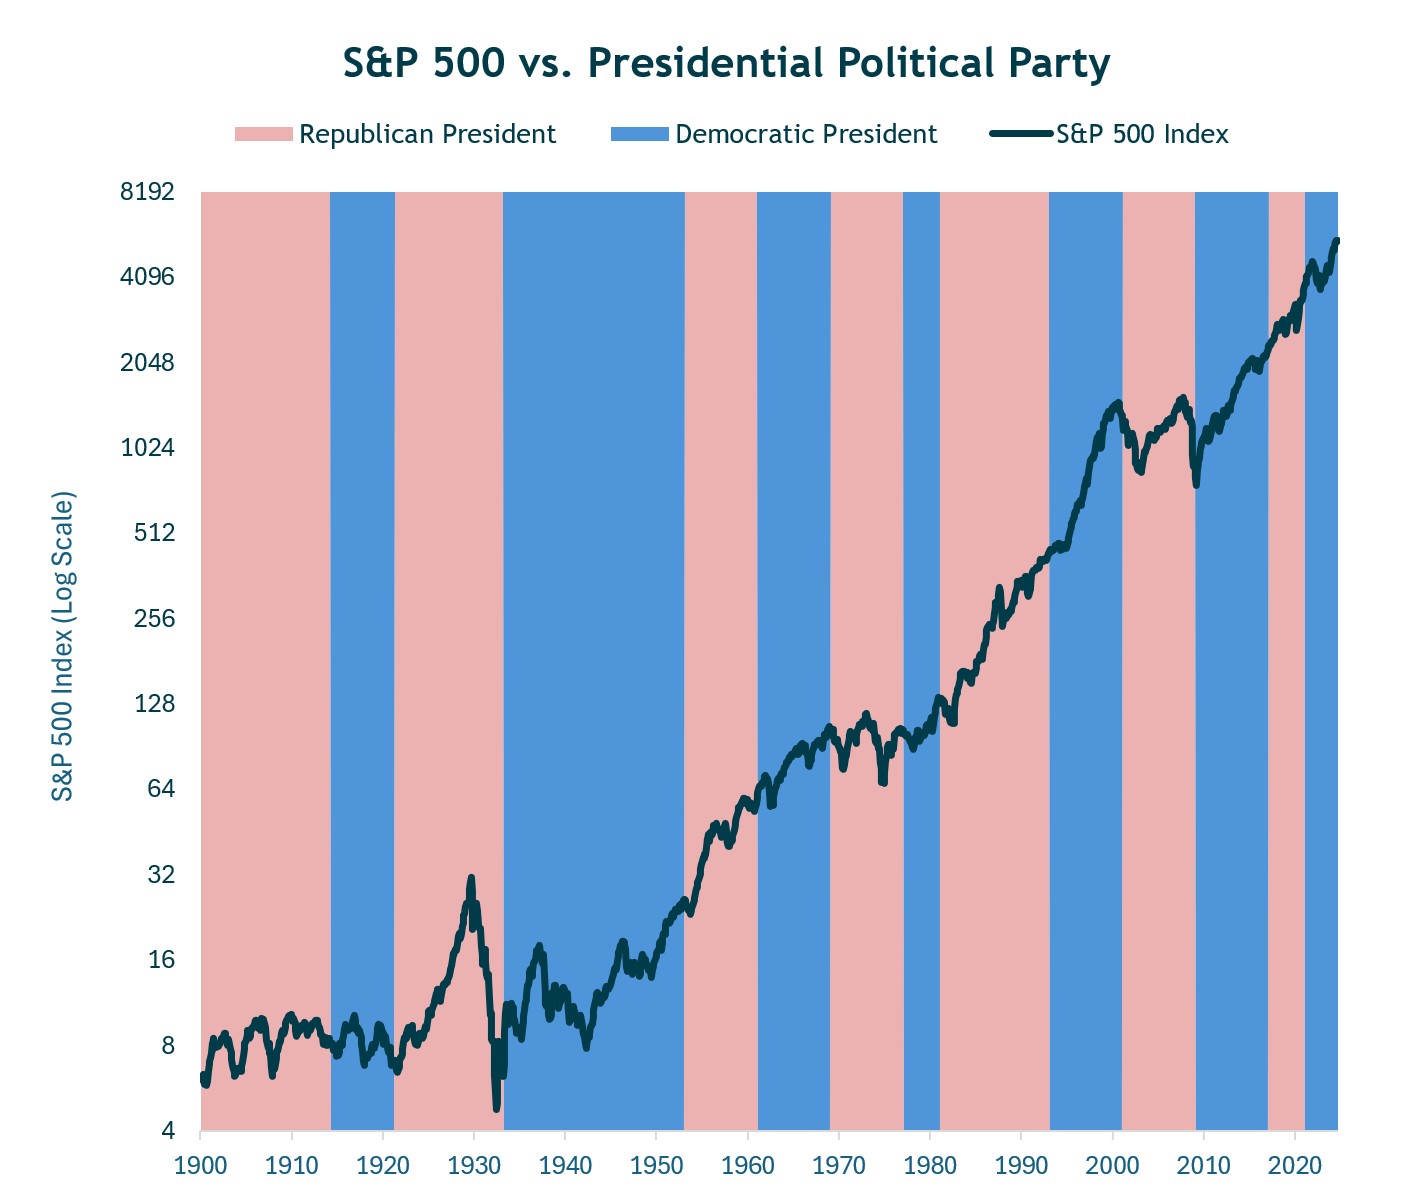
Source: Bloomberg. Data as of 9/30/2024.
Asset Class Returns By Presidential Term
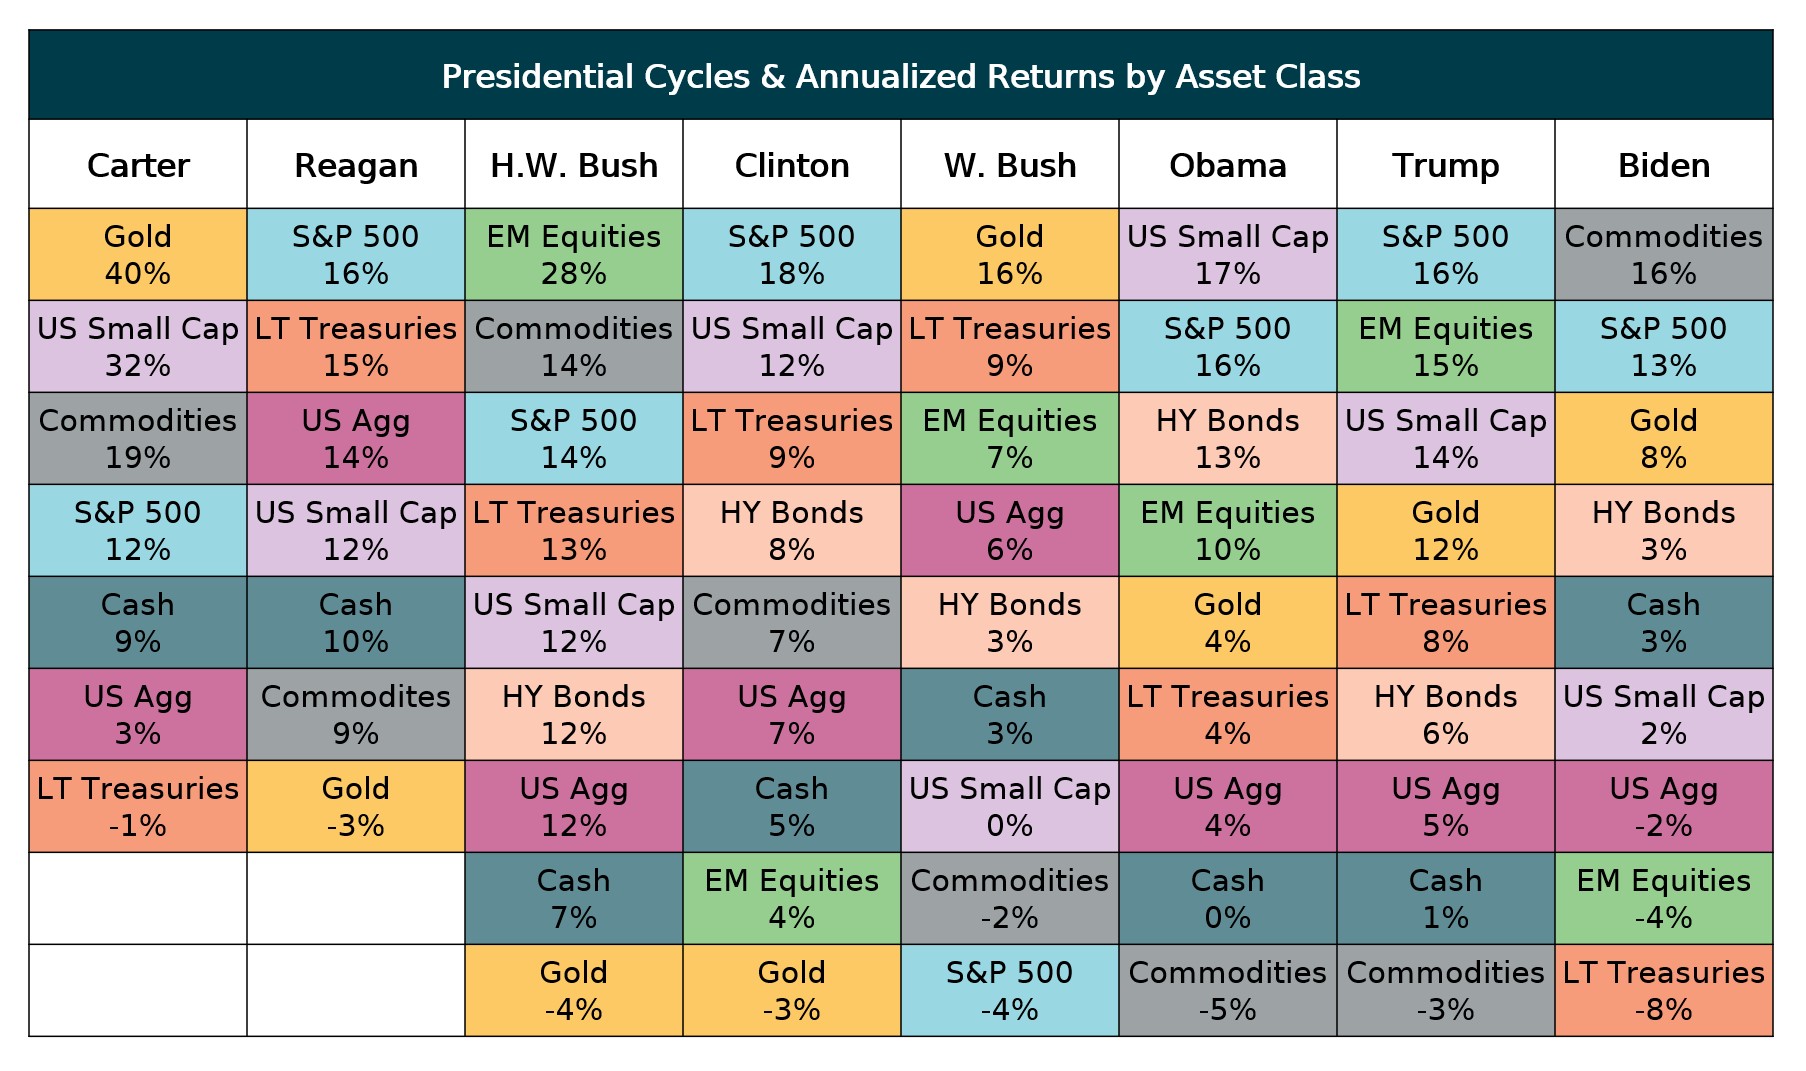
Source: Richard Bernstein Advisors. Data as of 8/31/2024.
Following a Fed Tightening Cycle Equity Returns Have Generally Been Positive in Lower Inflation Environments
- When inflation is not elevated, the Fed can move to a more accommodative stance much sooner, which has generally been positive for equities. This can be seen in the post 1980’s in terms of the much shorter time between the final rate hike and the subsequent rate cut.
- Most of the negative outcomes occurred during bouts of elevated inflation (particularly through the 60’s and 70’s). Because of higher inflation, the Fed will typically maintain a more restrictive policy – i.e., it will take them longer to pivot and cut rates (higher for longer).
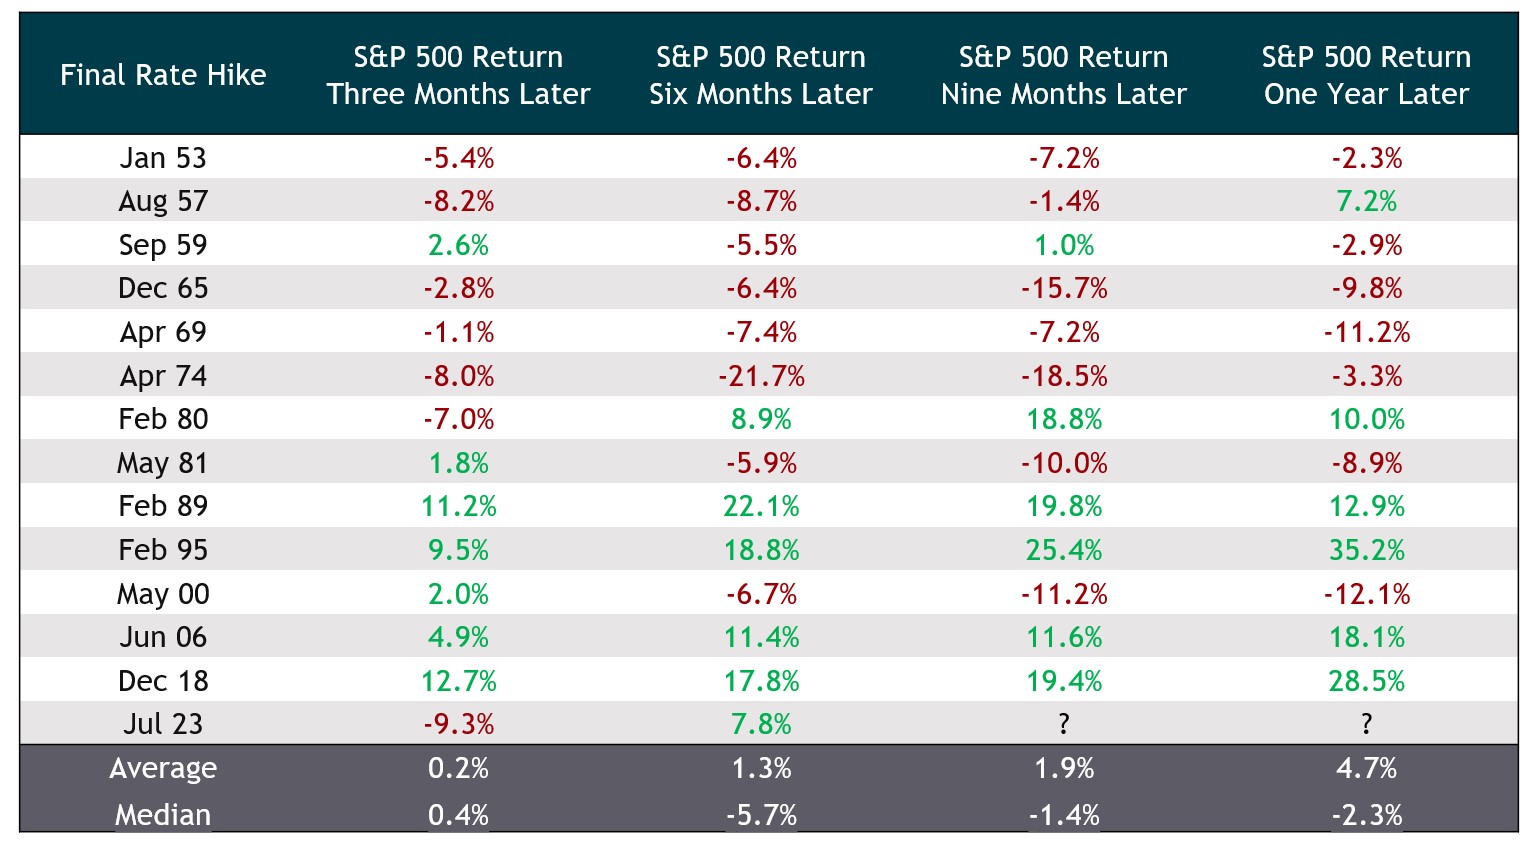
Source: iM Global Partner and Board of Governors of the Federal Reserve System. Data as of 3/31/2024. S&P 500 Index price returns shown.
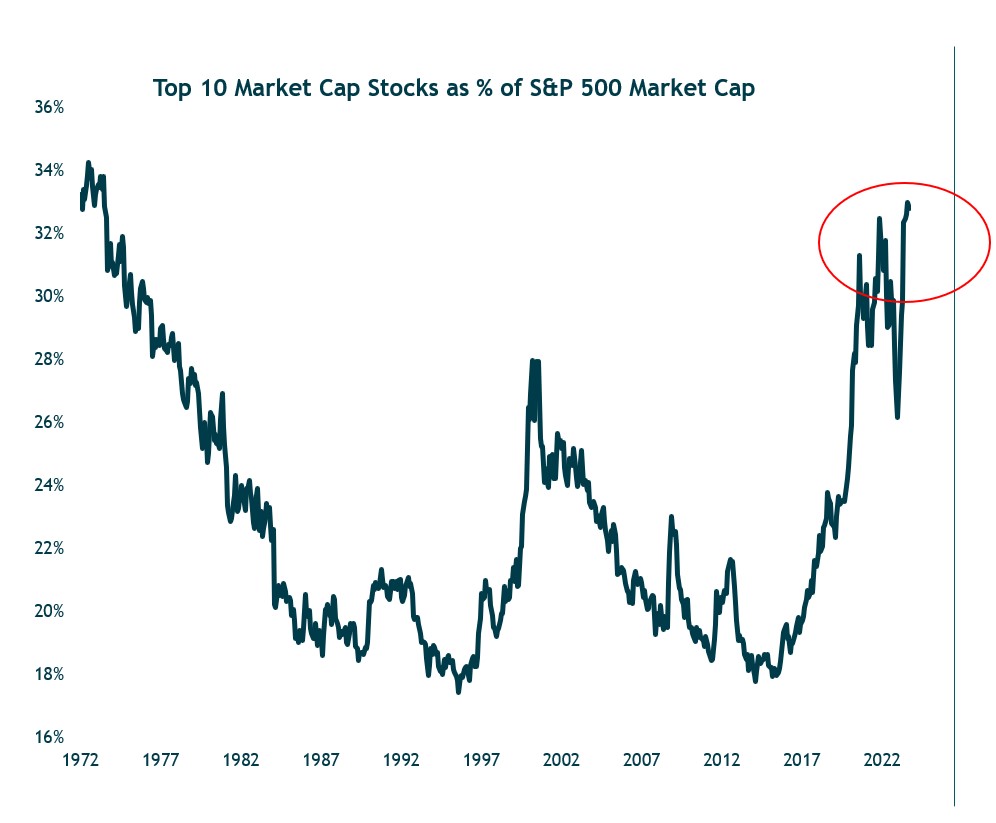
Concentration Within the S&P 500 is at its Highest Levels in 50 Years
- The concentration within the S&P 500 has soared past where it was in 2021 and the tech bubble. It is closing in on a level last seen during the early-1970s—a period known for the leadership of the Nifty Fifty stocks.
- This chart shows the 10 largest stocks accounting for more than 30% of the total market capitalization of the S&P 500.
Source: Ned Davis Research. Data as of 9/30/2024.
