Market Review
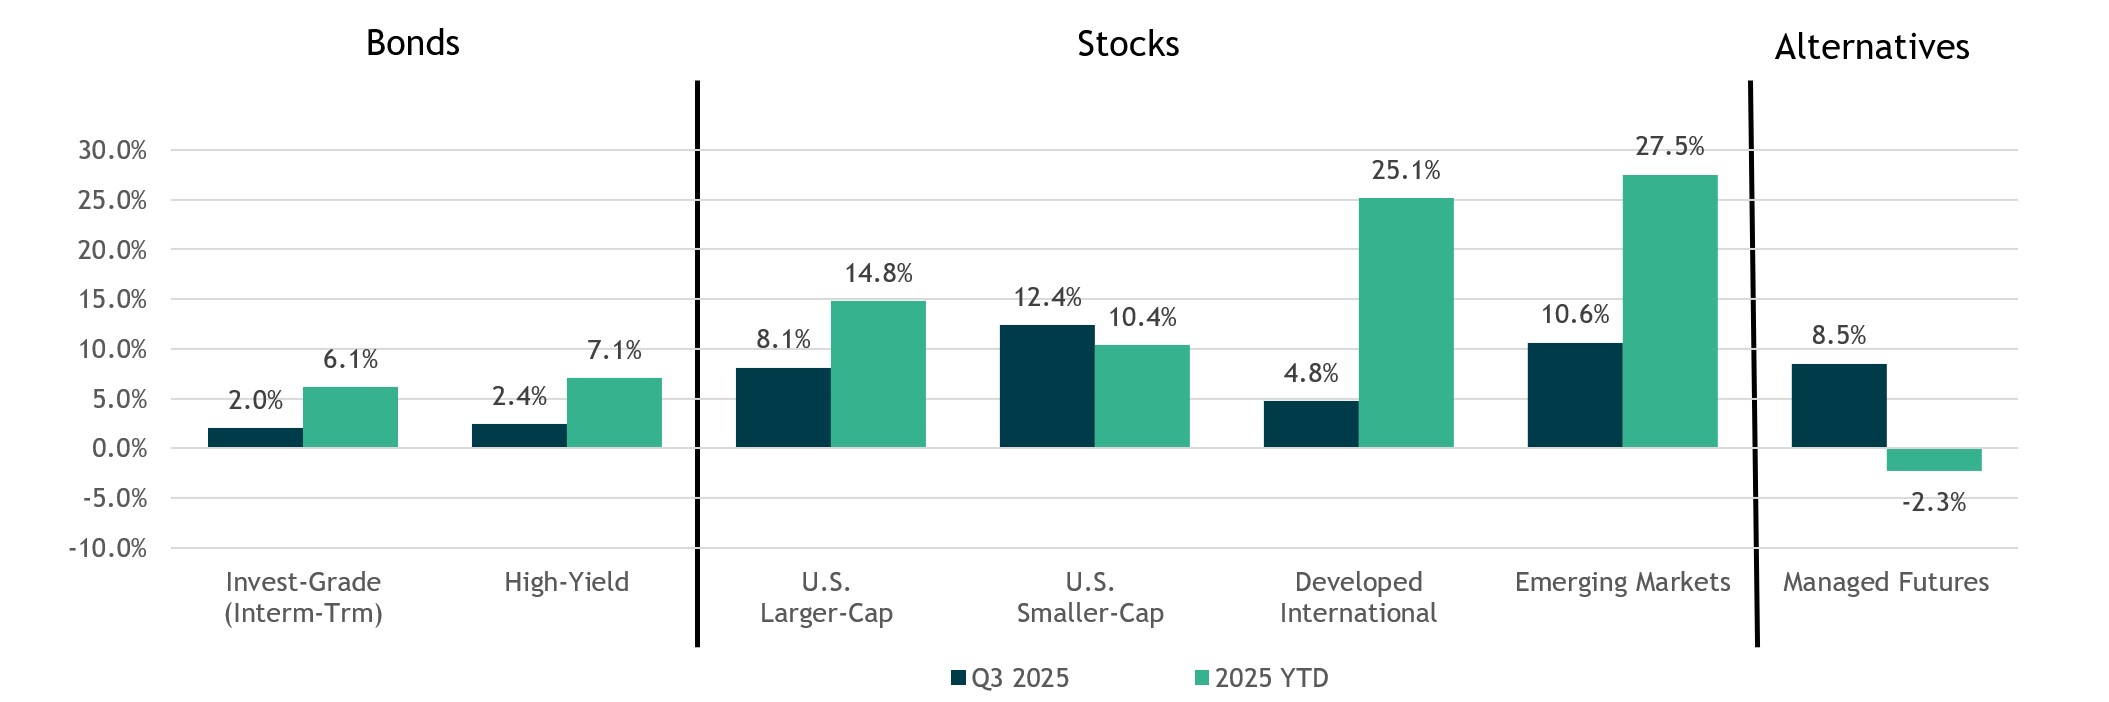
- U.S. Stocks (S&P 500 Index) continued to climb the wall of worry in the third quarter, gaining over 8%. Returns continue to be driven by stocks in the tech sector, lifted by the optimism around Ai-driven investment themes. The rally extended to U.S. small cap stocks (Russell 2000), which ended the quarter up over 12% amid hopes that lower interest rates would benefit the asset class.
- International stocks (MSCI EAFE) continued their run of solid performance for the year, rising nearly 5% in Q3, lifting its year-to-date return to 25%. Emerging-market stocks were the standout performer in Q3, rising 10.6% bringing their year-to-date total to over 27%. Gains in the quarter were driven by easing global financial conditions and attractive valuations. Year-to-date, developed international and emerging-market stocks are still outperforming U.S. stocks, thanks to a roughly 10% decline in the U.S. dollar.
- In the U.S. fixed-income market, after holding rates steady for the first eight months of the year, the Federal Reserve resumed rate cuts in September. Against this backdrop, investment-grade core bonds (Bloomberg US Aggregate Bond Index) finished the quarter up 2.0%, while high-yield bonds were up 2.4% (ICE BofA US High Yield). On a year-to-date basis investment-grade bonds are now positive 6.1%, while high-yield is up 7.1%.
Performance reflects index returns as follows (left to right): Bloomberg US Aggregate, ICE BofA US High Yield, S&P 500, Russell 2000, MSCI EAFE, MSCI EM, SG Trend Index. Source: Morningstar Direct. Data as of 9/30.2025.
Performance reflects index returns as follows (left to right): Bloomberg US Aggregate, ICE BofA US High Yield, S&P 500, Russell 2000, MSCI EAFE, MSCI EM, SG Trend Index. Source: Morningstar Direct. Data as of 6/30.2025.
The Fed is Balancing Inflation Risk Alongside Economic Slowing Growth
- The Federal Reserve re-initiated rate cuts in late September, lowering the federal funds target range by 0.25% to 4.00%–4.25%.
- This was the first cut this year, but not the first of this cycle. The Fed previously eased three times from September to December 2024, totaling 100 basis points of cuts, but paused over concerns that inflation remained stubbornly elevated above their 2% target and that policy might be loosening too quickly.
- For now, moderating inflation gave the Fed room to cut rates; two more cuts are projected by year-end.
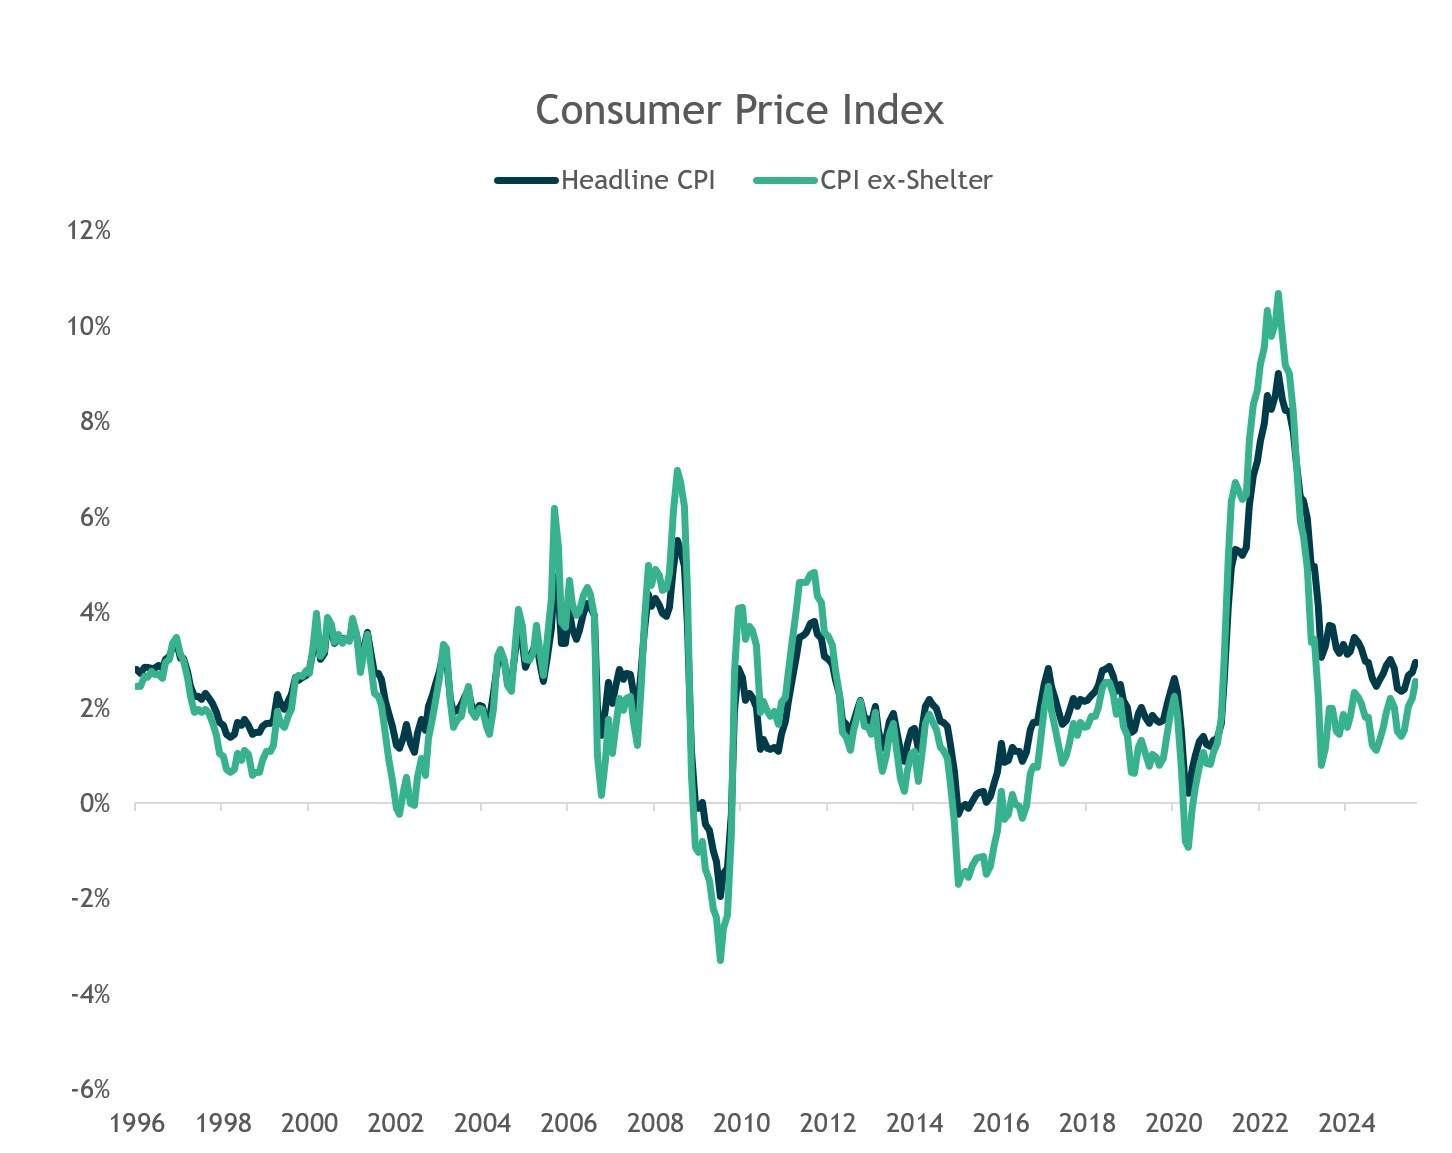
Source: U.S. Bureau of Labor Statistics. Data as of 8/31/2025.
Labor Market Data Indicates the Economy is Slowing
- The Fed’s recent decision to cut was positioned by Fed Chair Powell as a “risk-management” step given concerns over softening labor market data and slowing economic growth.
- Looking ahead, the Fed is leaving the door open for additional cuts, but Powell has been careful to emphasize that further easing will be data dependent with the goal of balancing the risk of higher inflation with supporting growth.
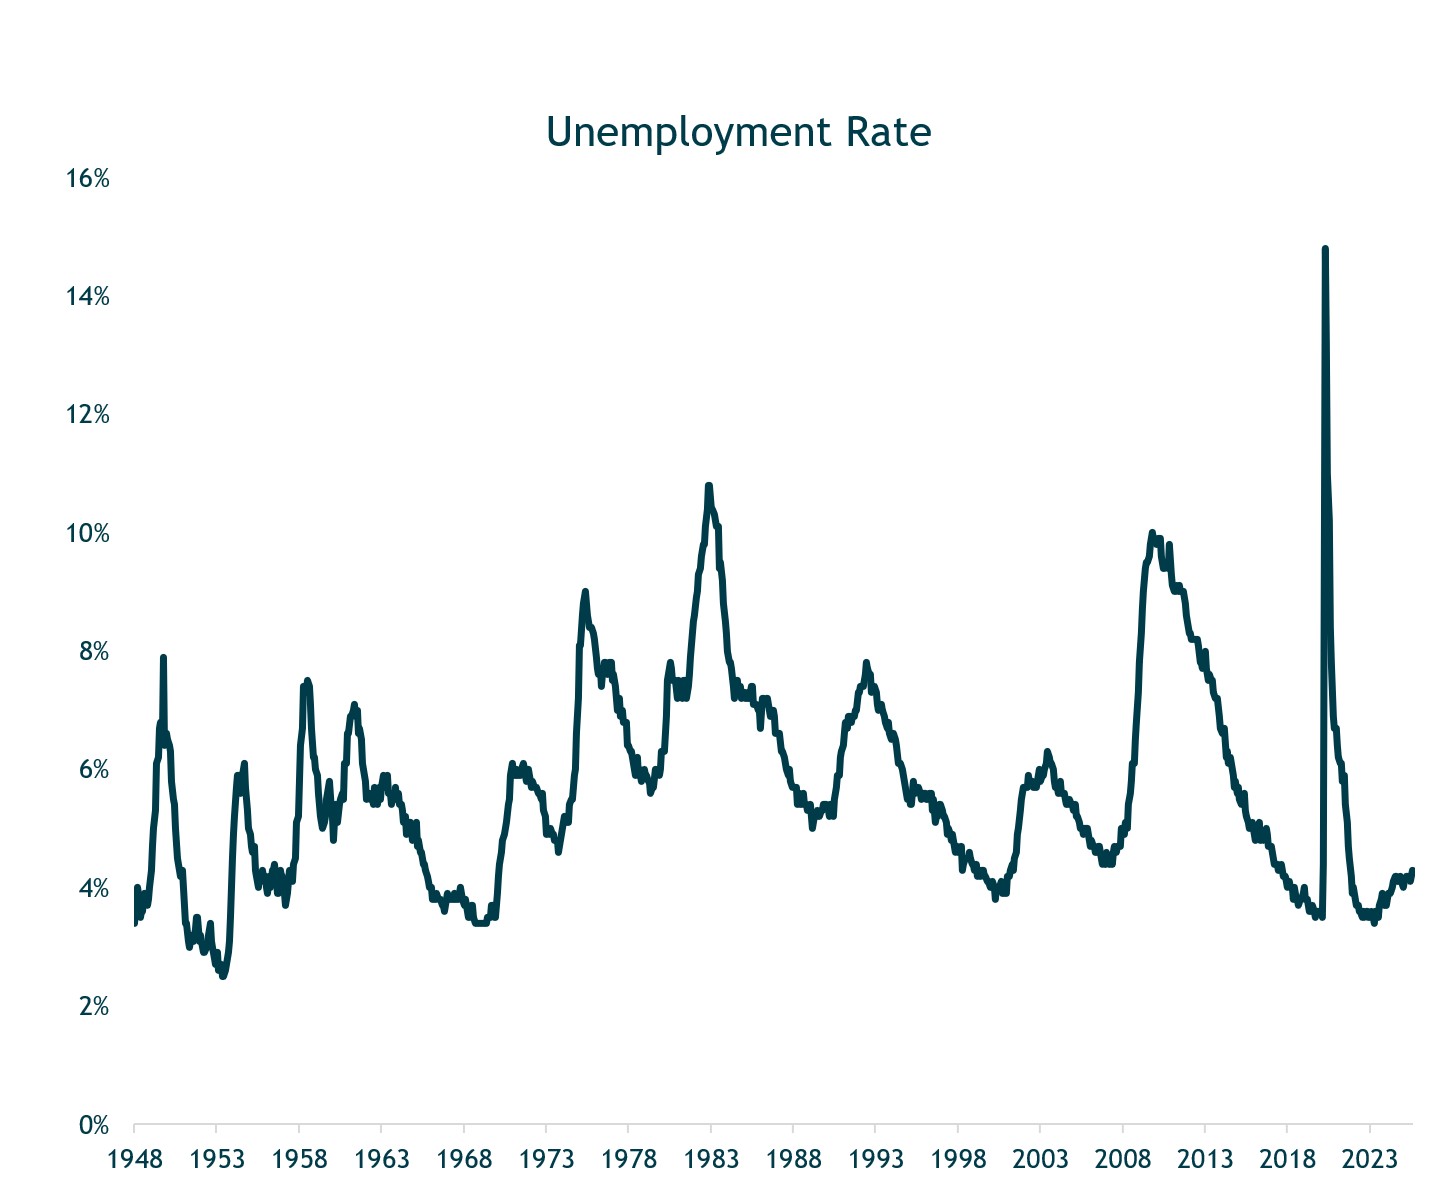
Source: U.S. Bureau of Labor Statistics. Data as of 8/31/2025.
The Fed Cut Rates in September; Two More Cuts Projected by Year-End
- One metric we use to assess how accommodative or restrictive Fed policy is, is the real (inflation-adjusted) fed funds rate. Today, the real fed funds rate stands at roughly 1.2%.
- In prior cycles, levels of 3.5% or higher have historically proven too restrictive, ultimately choking off growth and leading to recession as the Fed waits too long to ease.
- Today, we think the level of real fed funds rate needed to cool an overheated economy is lower than past cycles given lower trend growth relative to history.
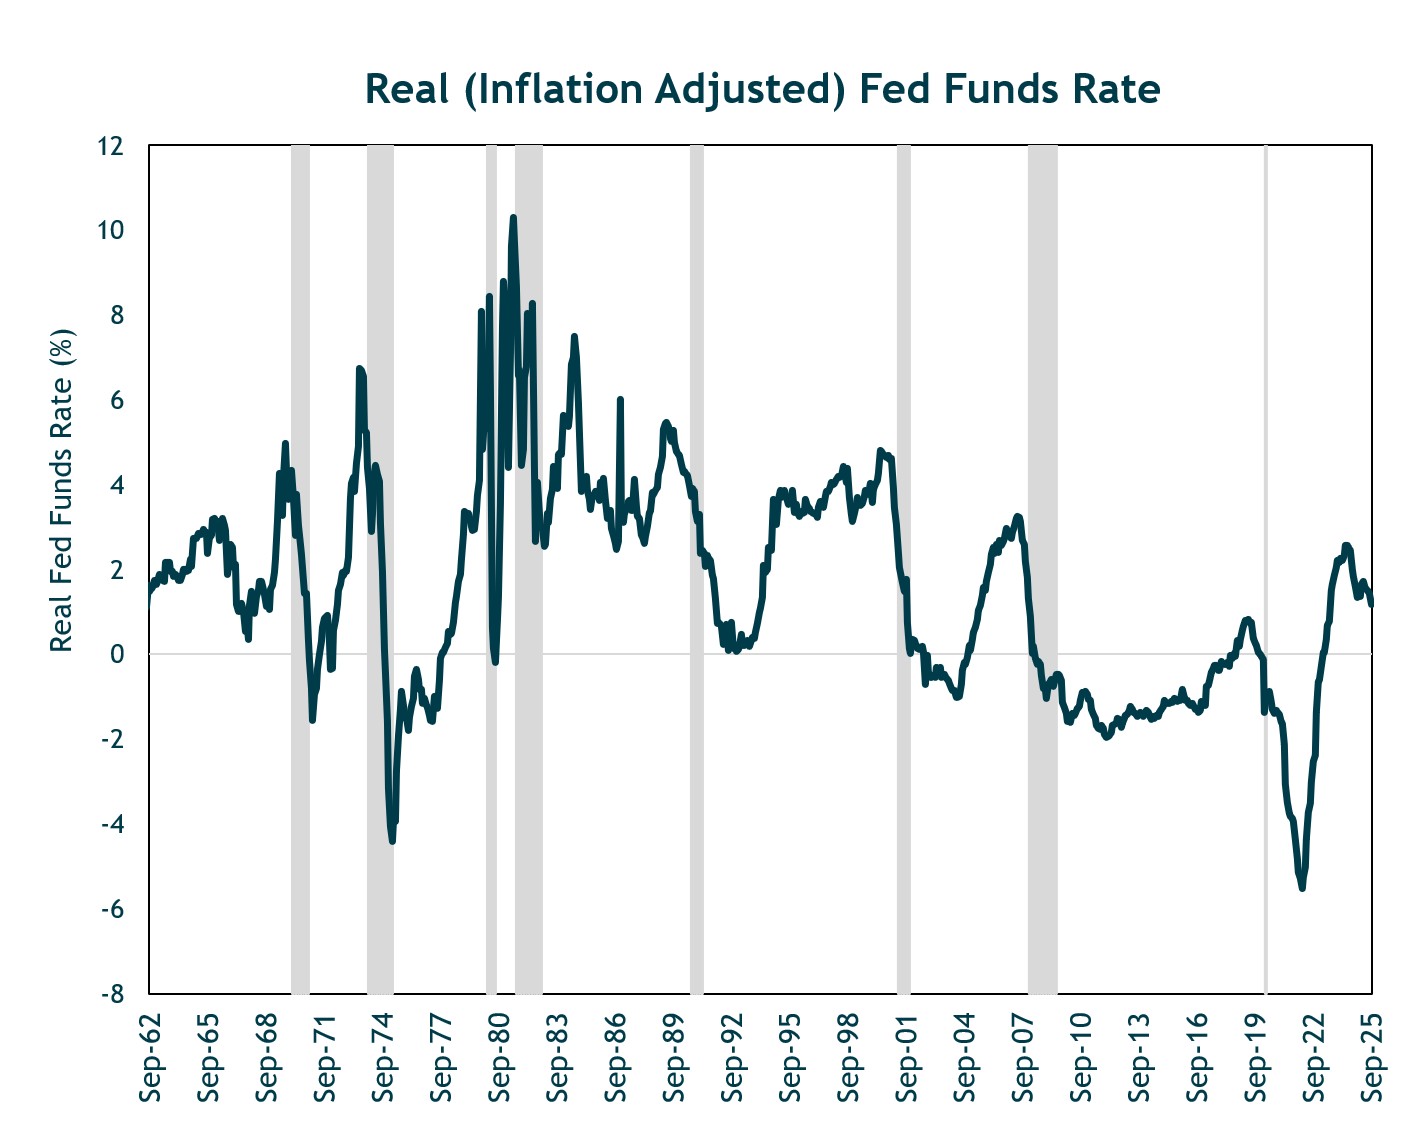
Source: FED, As of September 2025
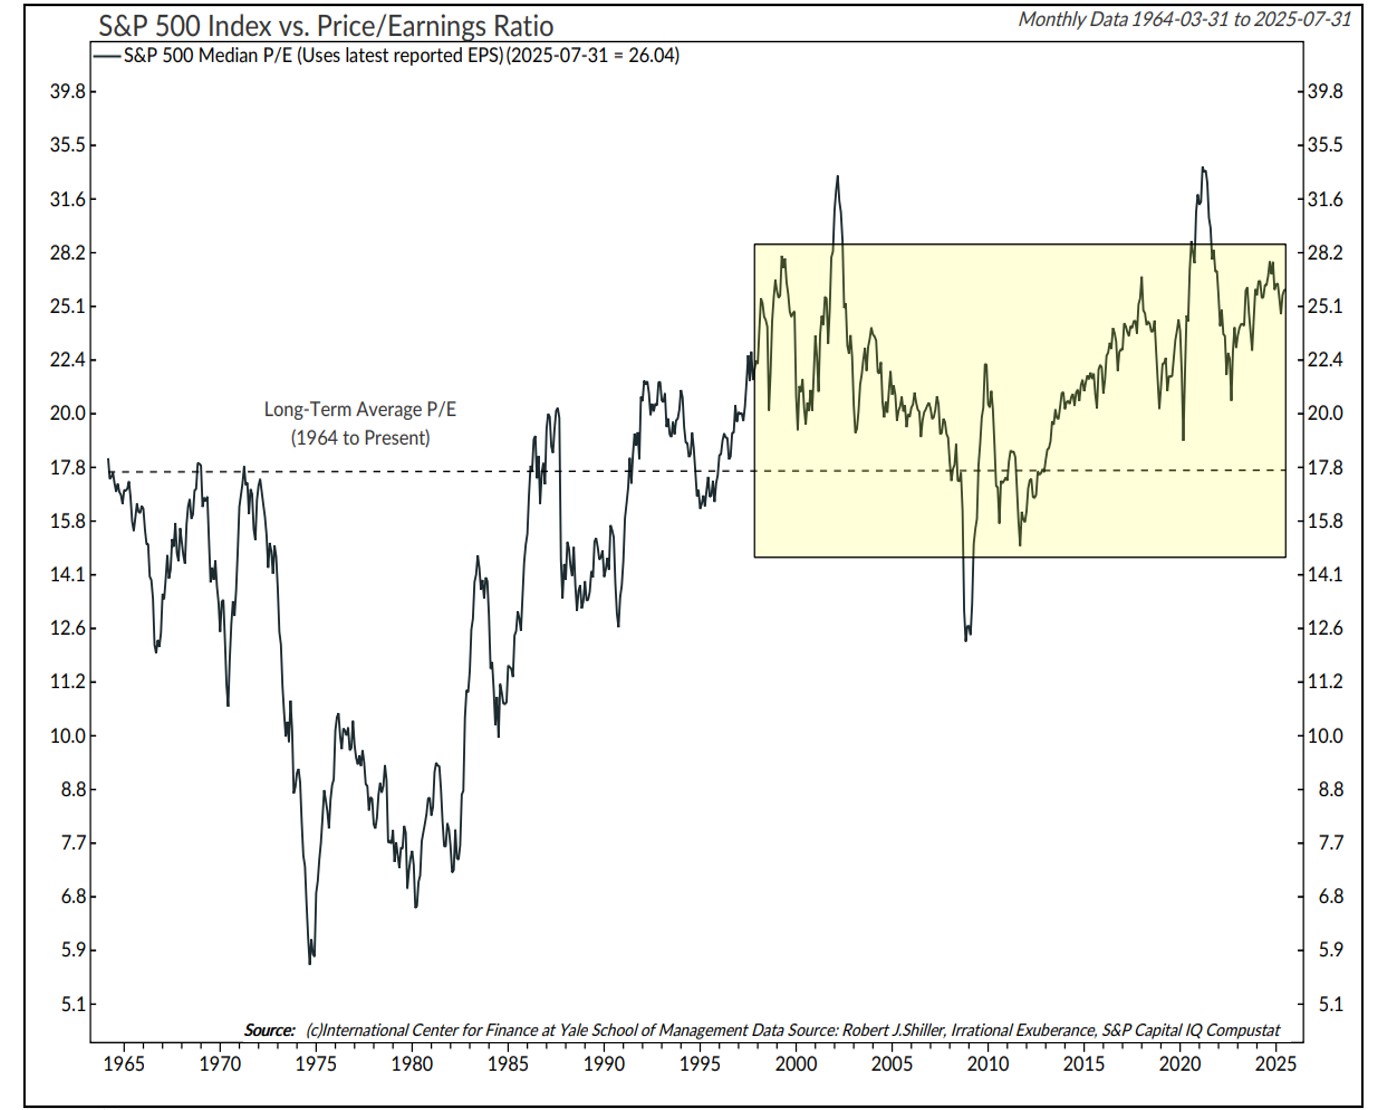
U.S. Equity Valuations are Expensive but not Excessive
- With U.S. stocks near all-time highs, current price levels raise the question of valuations.
- At present, the S&P 500 trades at roughly 26x trailing 12-month earnings compared to a long-term average of 17.8x.
- These levels are not lost on us, and they remain a critical factor we monitor closely.
- Yet, context matters. As we can see in this chart, U.S. stocks have traded above its long-term average for most of the past 25 years.
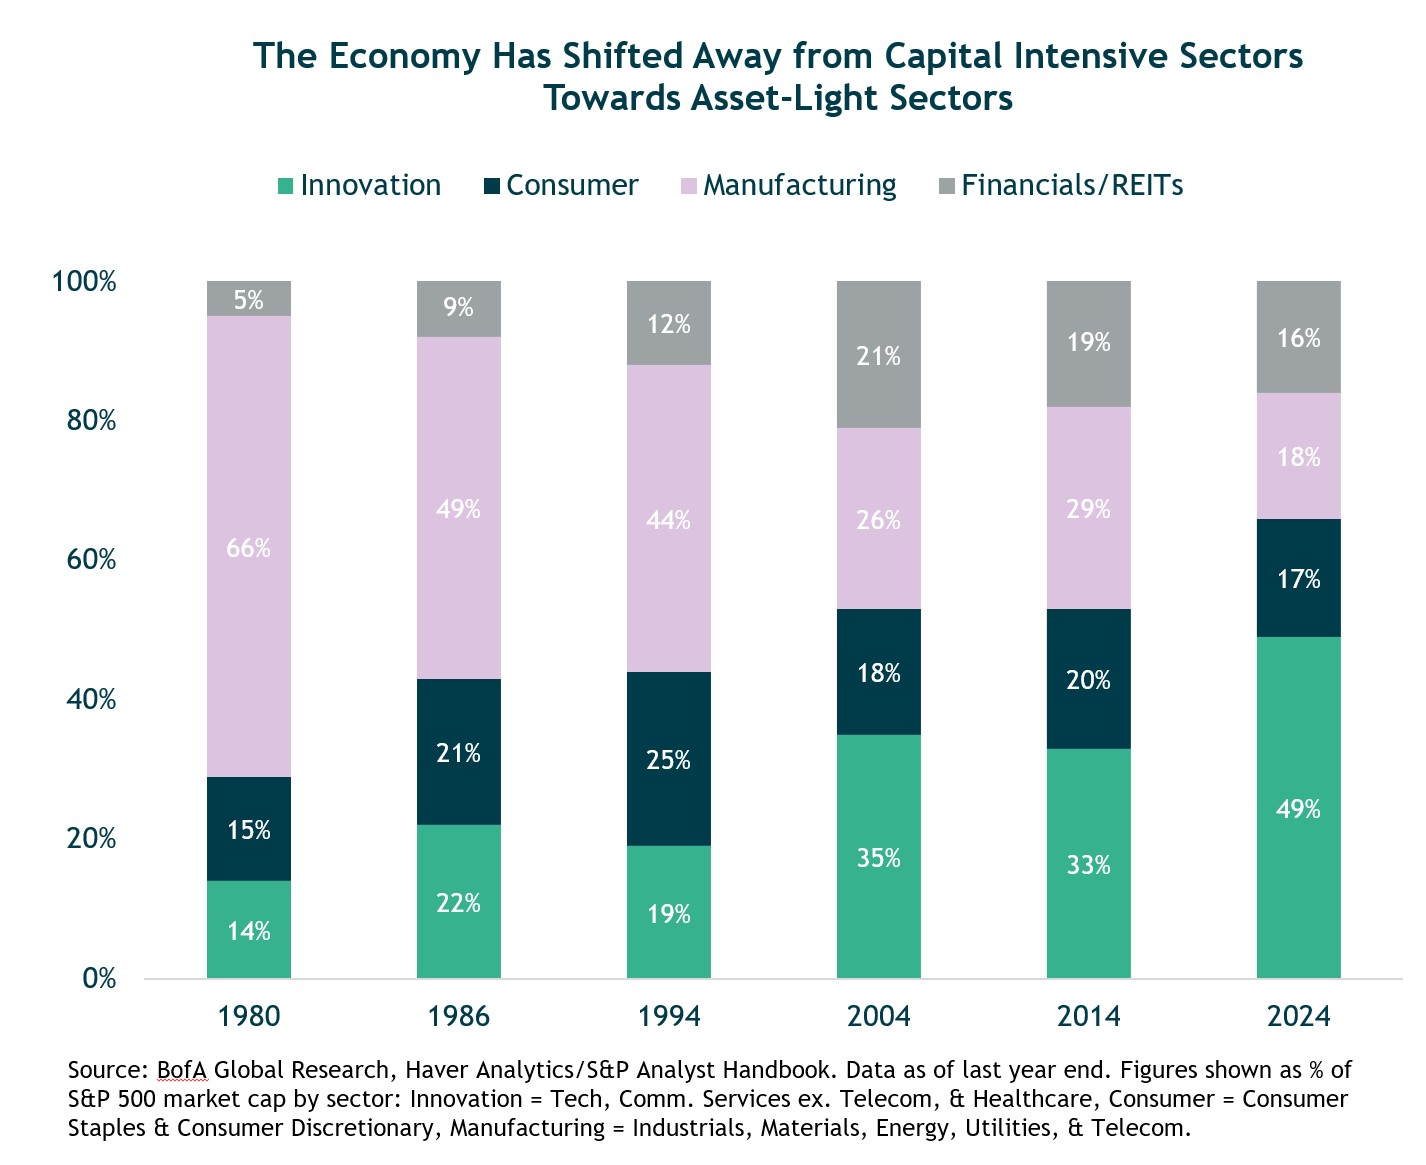
Tech Companies now Comprise a Larger % of the S&P 500
- Today’s economy looks very different than past decades. Historically, capital-intensive industries with lower margins and higher reinvestment needs dominated the market.
- Now, as shown in the chart to the left, technology and service-oriented companies, which scale efficiently, require less capital, and earn higher margins, represent a much larger share of the S&P 500.
- Today, roughly half of the index is represented by innovation-driven companies, while manufacturing has shrunk below 20%. Naturally, investors should apply different multiples to cyclical, capital-intensive firms versus high-margin, scalable businesses.
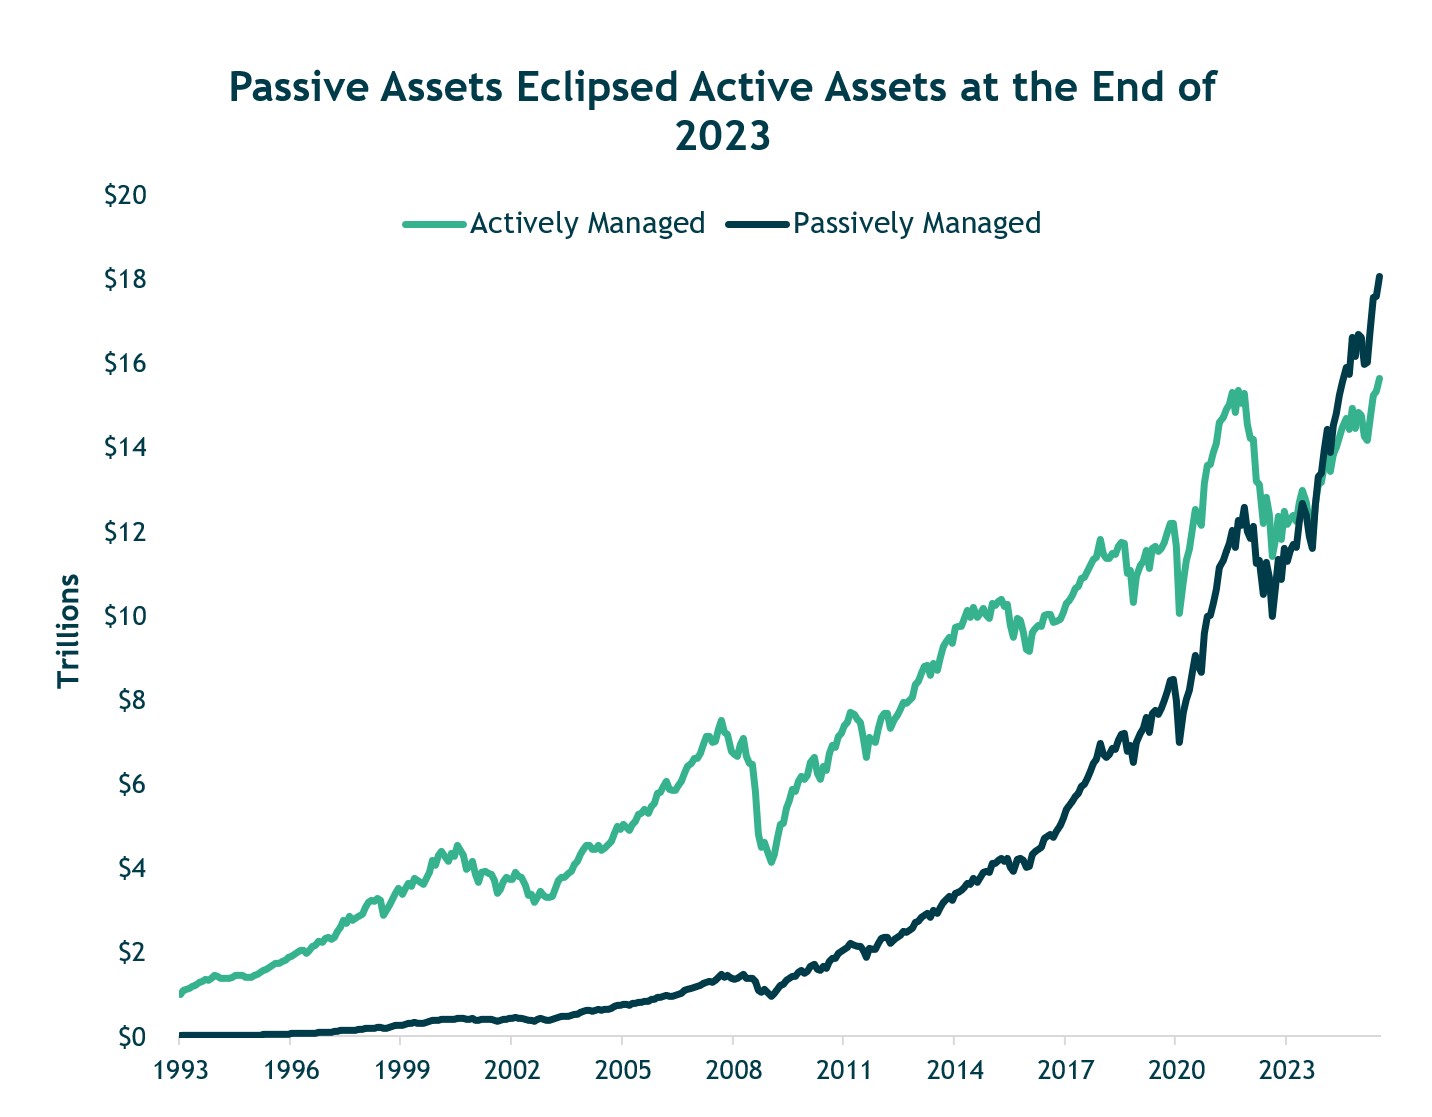
The Rise of Passive Investing has Distorted Valuations
- Beyond structural changes to the economy and composition of the S&P 500 Index, structural shifts in market dynamics also impact multiples.
- The rise of passive investing has fundamentally altered flows into equities. With defined contribution plans replacing defined benefit pensions, most workers invest steadily into markets regardless of valuations.
- Morningstar data shows that as of late 2023, passive assets overtook active assets for the first time. These consistent inflows, which are often valuation-agnostic, provide some support for higher multiples.
Source: Morningstar Direct. Data as of 8/31/2025.
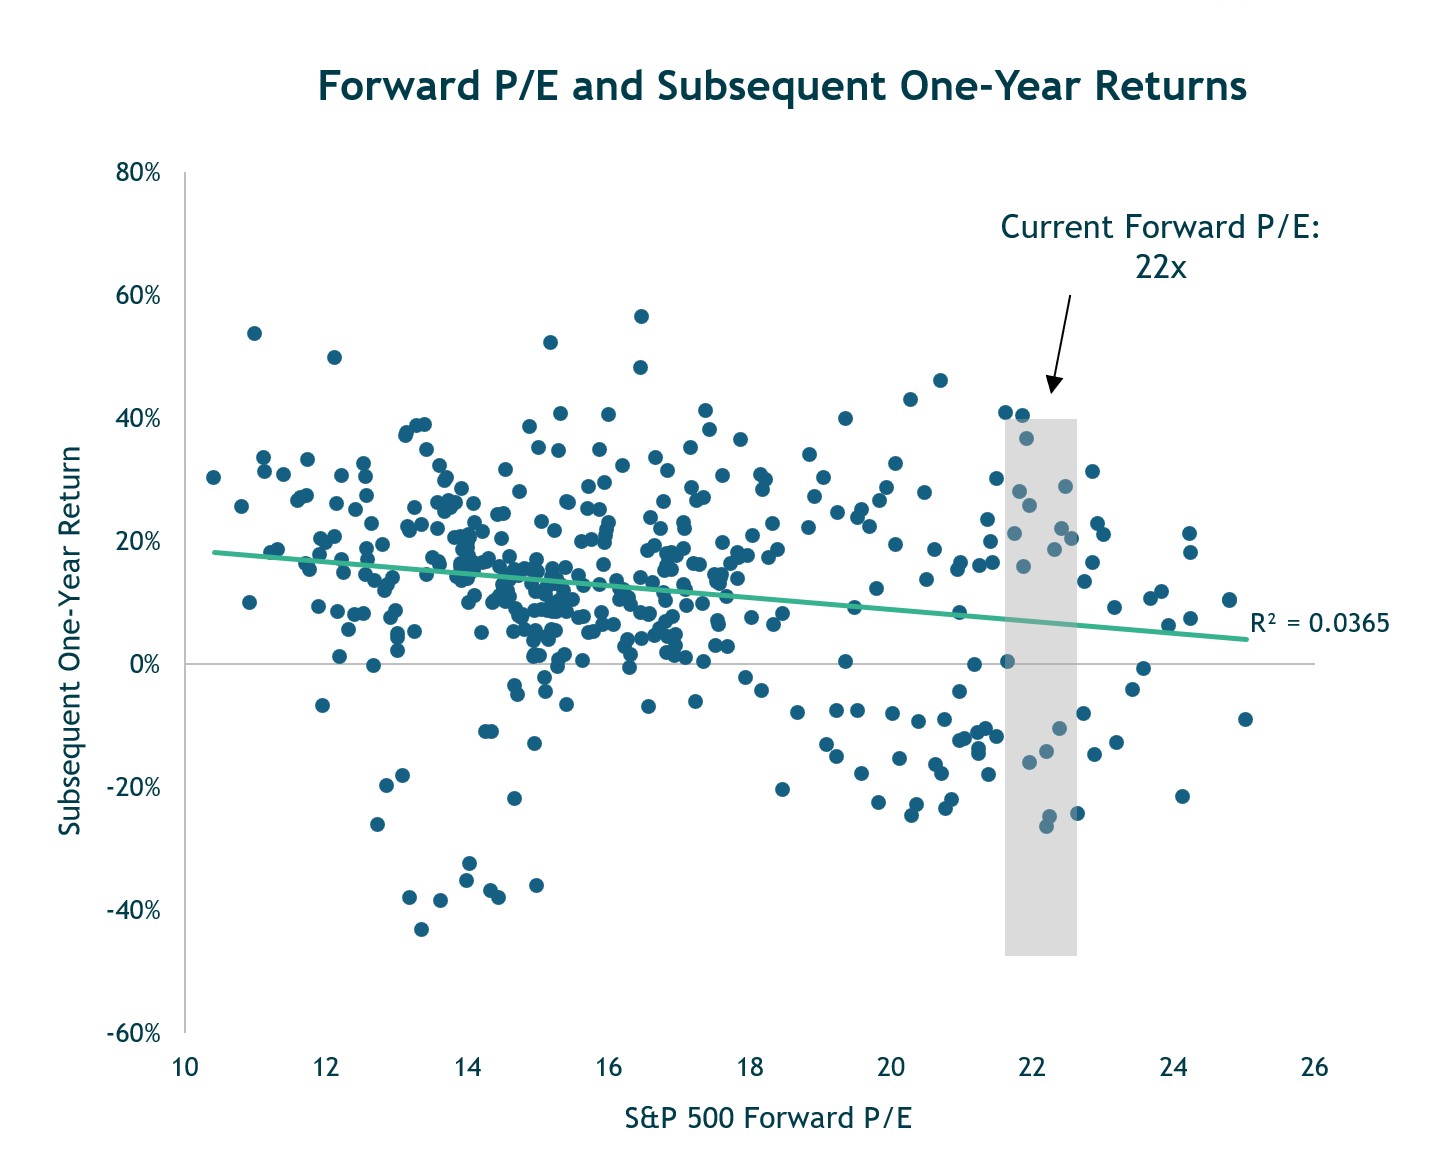
Expensive Starting Valuations can Still Lead to Good Returns
- Today, valuations are at about 22x forward earnings, which is high relative to history. When we look at past periods (shown in the gray shaded bar in the chart below), subsequent 12-month returns following similar valuation levels have been extremely wide, ranging from significant losses to strong gains.
- This wide dispersion highlights that while valuations can inform long-term expected returns, they are a poor tool for short-term market timing.
- Other factors such as earnings growth, monetary policy, and investor sentiment tend to play a much larger role in driving market performance over a one-year horizon.
Source: Bloomberg LP. Data as of 9/25/2025.
Diversification Has Benefitted Portfolios This Year
- Portfolios benefited from global diversification despite a very volatile first half of the year.
- International equities outperformed U.S. by wide margins in part due to a falling U.S. dollar.
- Fixed income also generated solid returns and importantly, provided stability when risk assets were down early in the year.
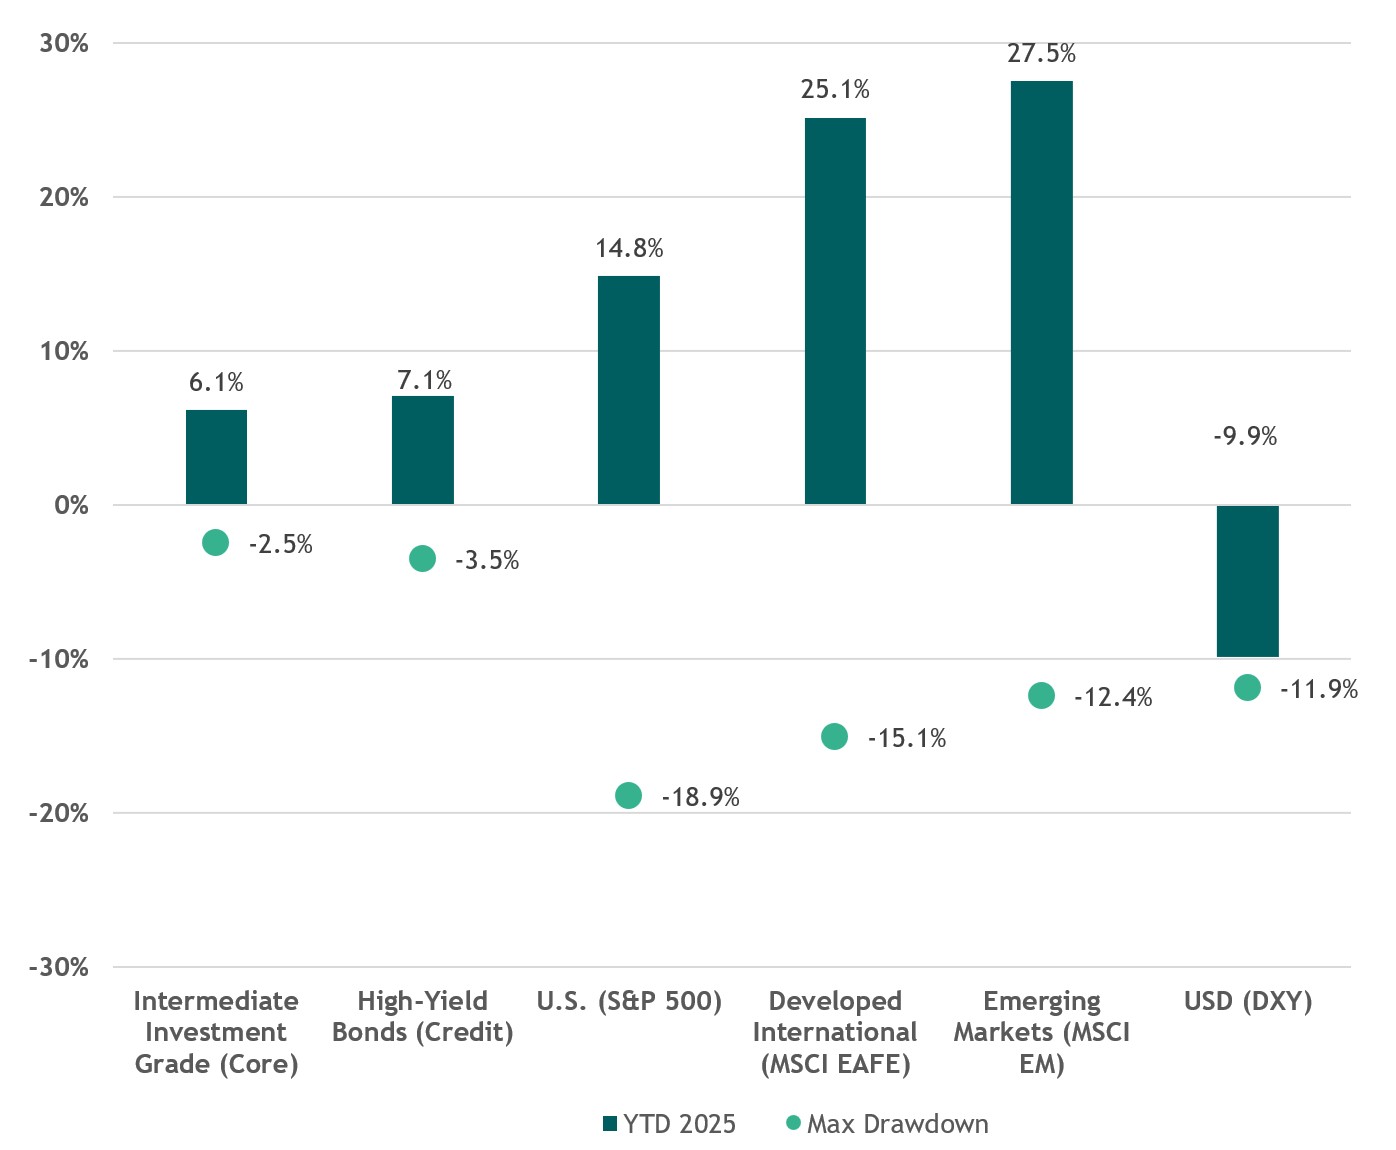
Maximum drawdown for equities calculated using price return and reflects largest peak to trough drawdown during the year. Source: Bloomberg, FactSet. As of 6/30/2025. Performance reflects index returns as follows (left to right): Bloomberg US Aggregate, ICE BofA US High Yield, S&P 500, Russell 2000, MSCI EAFE, MSCI EM, SG Trend Index. Source: Morningstar Direct. Data as of 9/30.2025.
A Weaker U.S. Dollar Has Historically Provided a Tailwind to Foreign Stocks
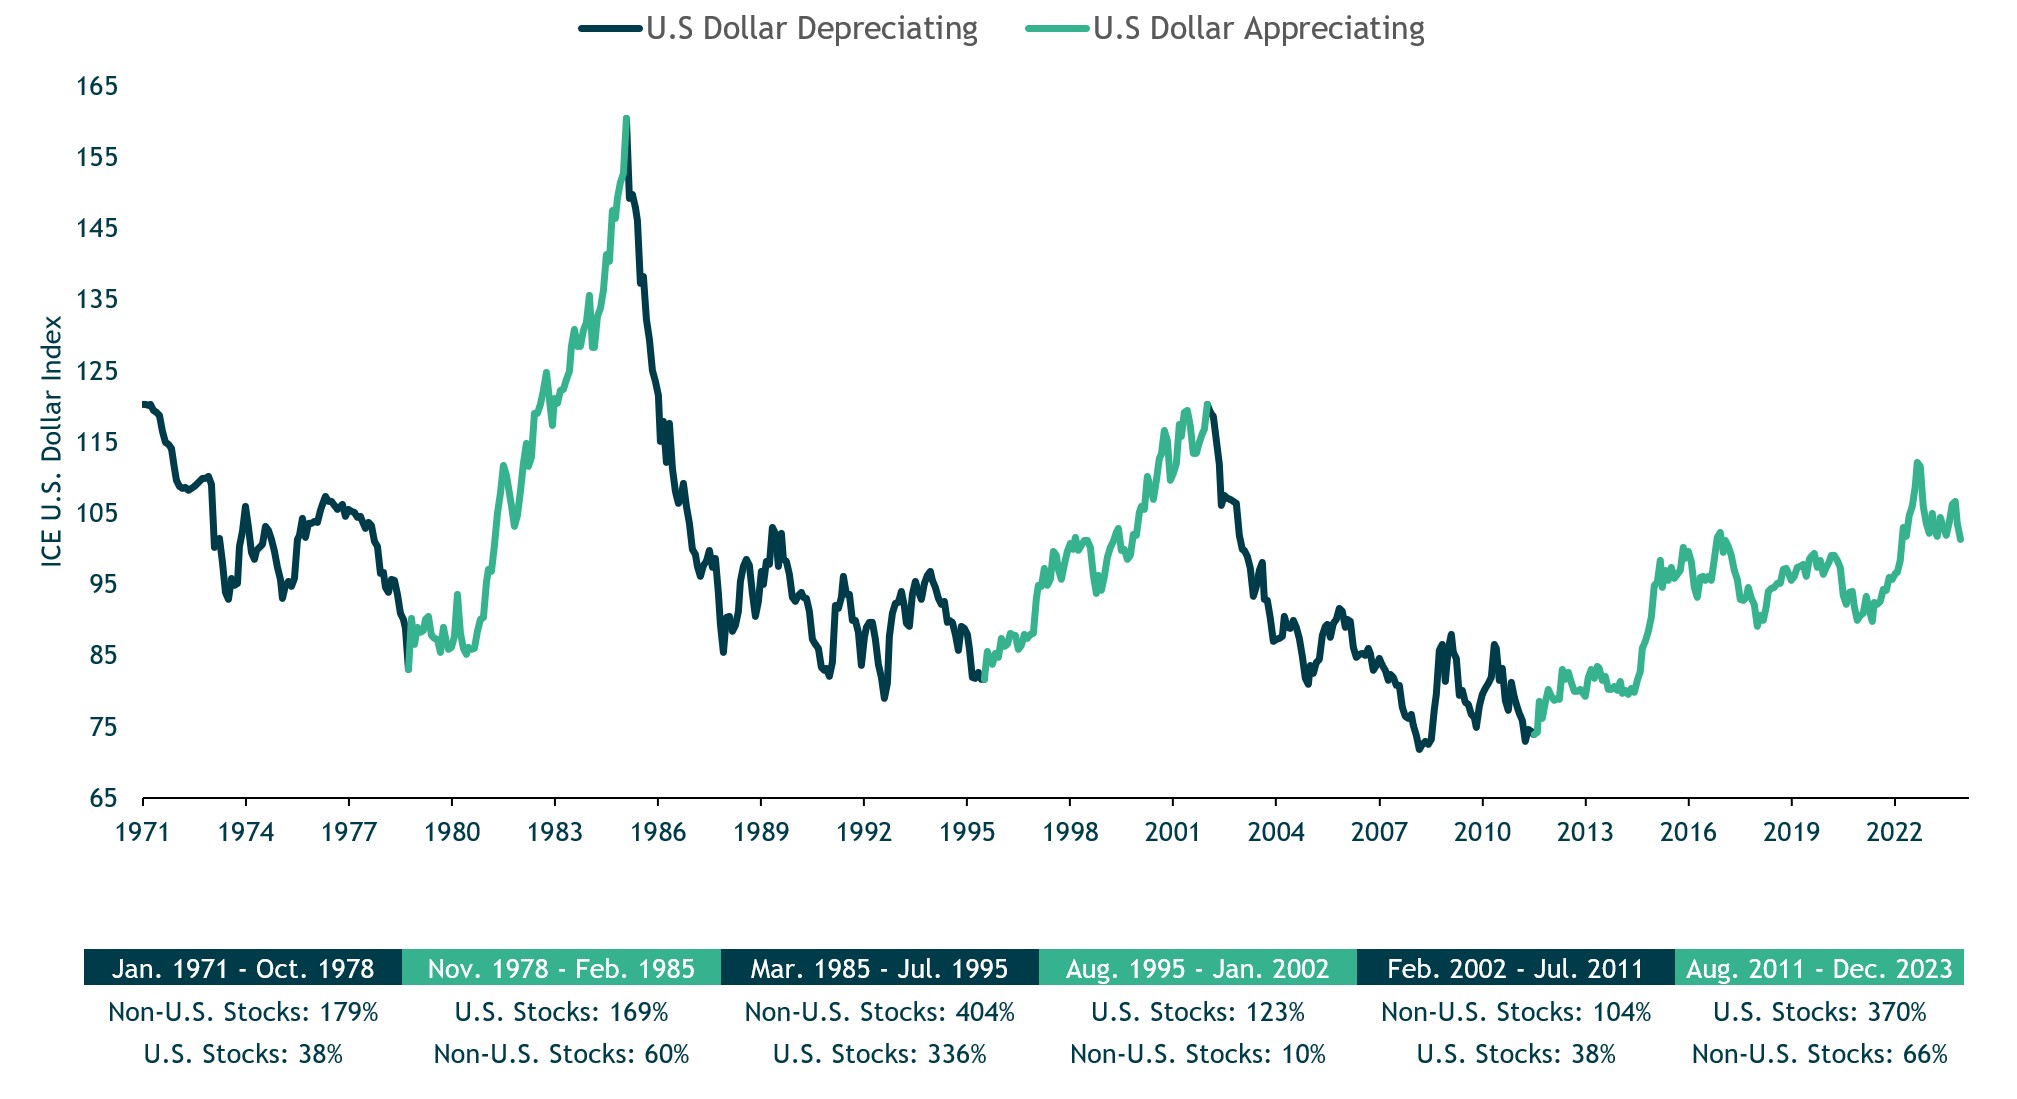
Source: Bloomberg LP and Morningstar Direct. Data as of 12/31/2023. Annualized returns in U.S. Dollars. U.S. Stocks: S&P 500. Non-U.S. Stocks: MSCI World ex. U.S. Index.