Market Review
- Aided by a powerful year-end rally, U.S. stocks (S&P 500 Index) jumped nearly 12% in Q4 to finish up 26% for the year, and end within a whisper of its all-time high. Smaller-cap stocks (Russell 2000 Index), which lagged their larger counterparts for most of the year, also rallied sharply in the fourth quarter (+14%) to end the year with a respectable gain of 17%.
- Developed International and emerging-market stocks also posted solid gains but couldn’t keep pace with U.S. markets. Developed International stocks (MSCI EAFE) gained a very respectable 18%, while emerging-market stocks (MSCI EM Index) posted nearly 10% returns.
- Bonds also rallied sharply in the fourth quarter aided by a significant drop in treasury yields. The benchmark 10-year treasury yield fell 100bps in Q4 resulting in a 6.8% return for the Bloomberg US Aggregate Bond Index. Interestingly, despite massive intra-year volatility, the 10-year treasury yield ended the year exactly where it started. For the year, the AGG finished up 5.5%. Credit was a standout performer both in Q4 and for the full year. High-Yield bonds (ICE BofA High Yield Index) were up 7.1% in Q4, finishing up 13.5% for the year.
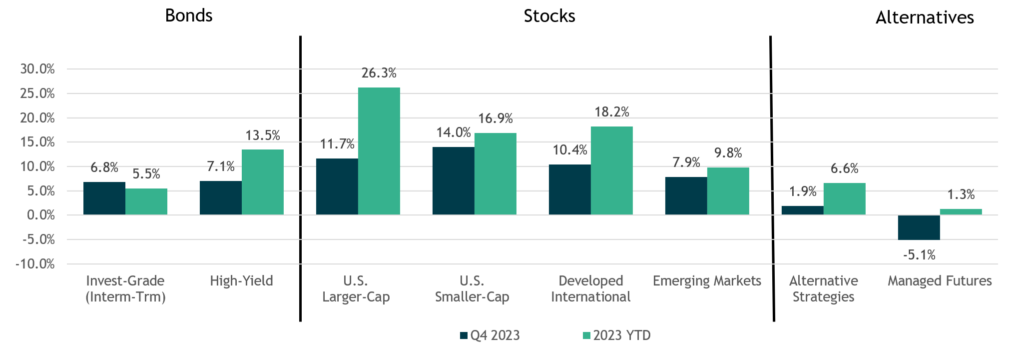
Performance reflects index returns as follows (left to right): Bloomberg US Aggregate, ICE BofA US High Yield, S&P 500, Russell 2000, MSCI EAFE, MSCI EM, Morningstar US Fund Multistrategy Index, SG Trend Index. Source: Morningstar Direct. Data as of 12/31/2023.
Historic Money Supply Growth Helped Fuel Inflation but as it Contracts, We Expect Inflation to Decline
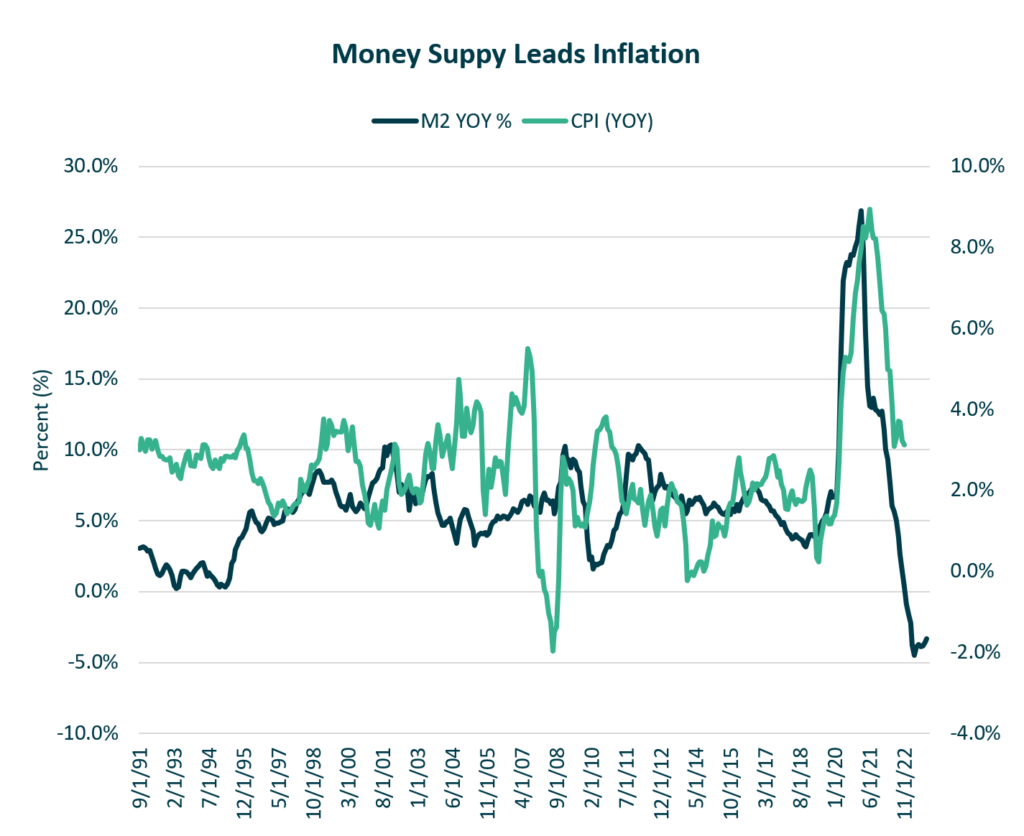
- This chart compares the year-over-year growth of money supply (or M2) and core CPI.
- A key driver of inflation was the dramatic increase in Money Supply (or M2) that occurred during the pandemic. Now that M2 is contracting, we suspect inflation could continue to decline from current levels.
- In late September, the Fed paused their rate hiking cycle but indicated there could be more hikes this year if inflation reaccelerates.
- Projections released in the Fed’s dot plot showed the likelihood of one more 25bps increase at the November 1 meeting, then two cuts in 2024.
Source: Federal Reserve. Data as of 12/31/2023
Concentration Within the S&P 500 is at its Highest Levels in 50 Years
- The concentration within the S&P 500 has soared past where it was in 2021 and the tech bubble. It is closing in on a level last seen during the early-1970s—a period known for the leadership of the Nifty Fifty stocks.
- This chart shows the 10 largest stocks accounting for more than 30% of the total market capitalization of the S&P 500.
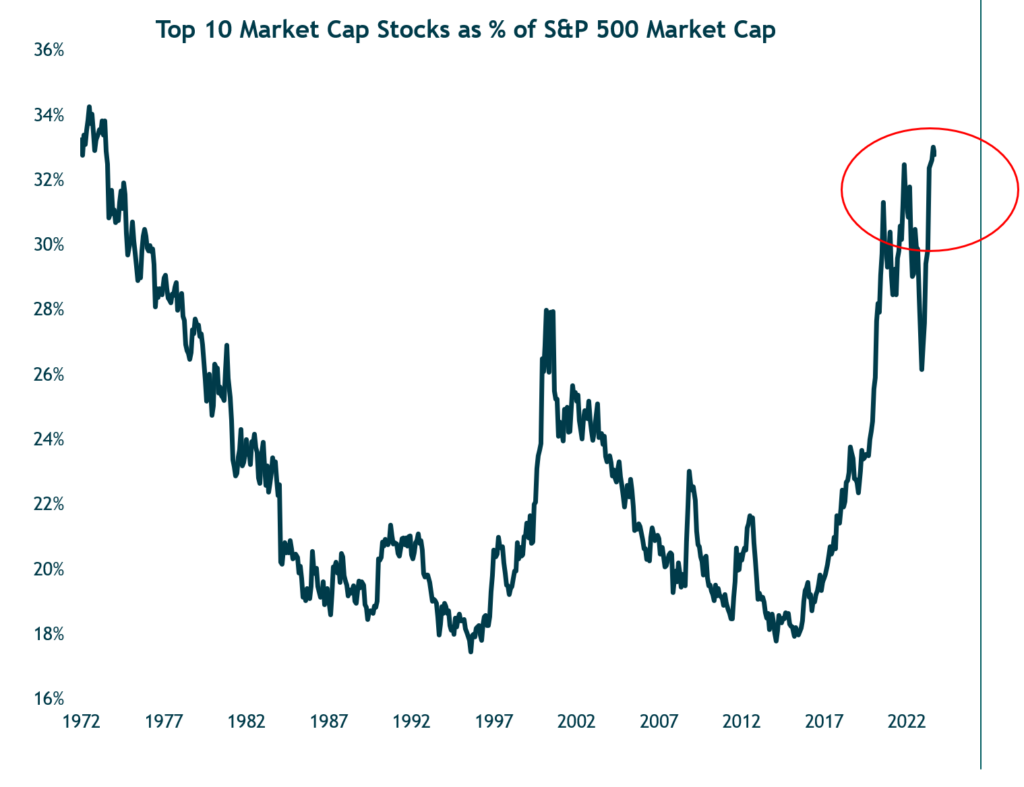
Source: Ned Davis Research. Data as of 12/31/2023.
There are Opportunities in U.S. Stocks Outside the
“Magnificent 7”
- Much of the performance in the “Mag 7” stocks was driven by multiple expansion – at year-end, the “Mag 7” stocks trade at a 35x multiple.
- By comparison, the remaining 493 stocks in the S&P 500 trade at a more reasonable multiple of 19x earnings.
- We believe there is potential for some out of favor segments of the stock market – value stocks, small caps, etc. to perform well in 2024.
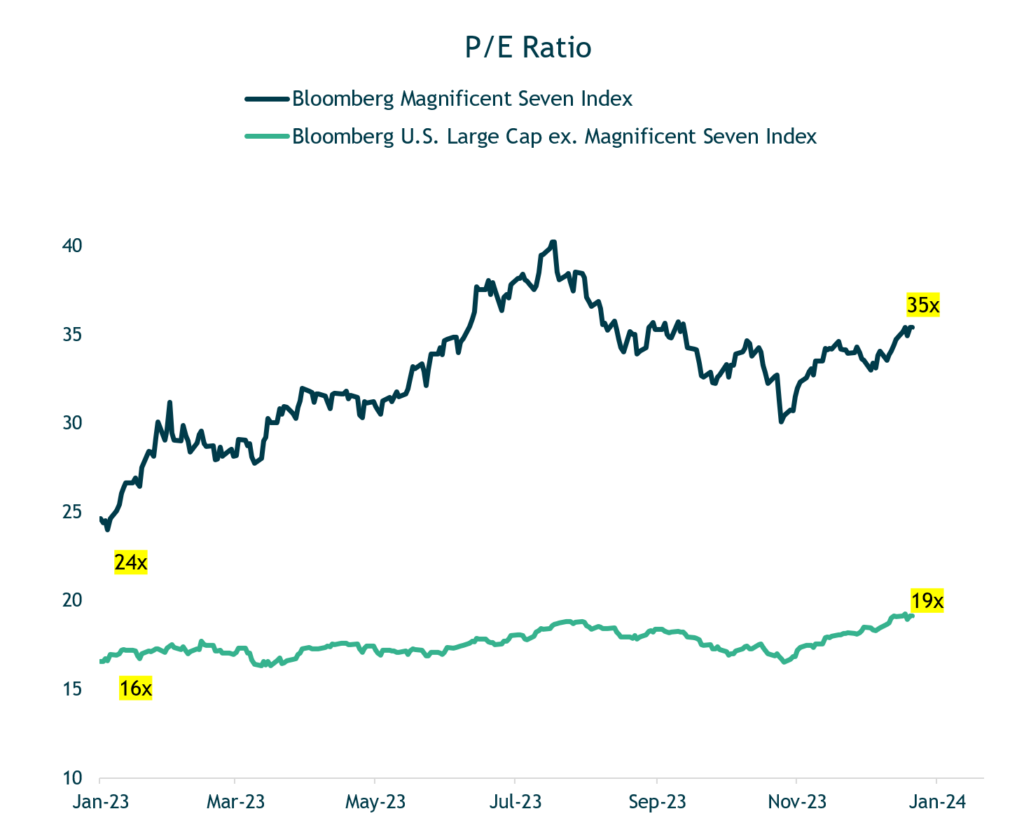
Source: Bloomberg LP. Data as of 12/31/2023. Magnificent Seven stocks: Alphabet, Amazon.com, Apple, Meta Platforms, Microsoft, Nvidia, Tesla.
Despite Massive Intra-Year Volatility, the Benchmark 10-Year Treasury Yield Ended the Year Exactly Where it Started
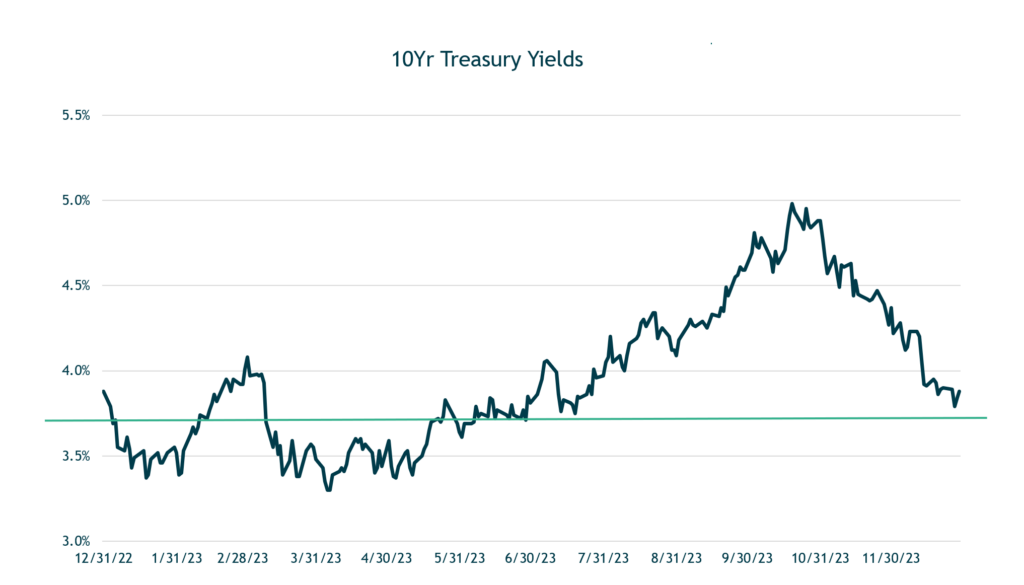
Source: Federal Reserve. Data as of 12/31/2023
The Yield Curve Remains Inverted
- There are many market indicators that support the recession outlook:
- The Treasury yield curve has been and remains steeply inverted, the Conference Board’s Leading Economic Indicator (LEI) has declined 18 straight months, and there is some clear evidence that tighter monetary policy is impacting the housing market and lending conditions, which impacts business investment.
- While we anticipate a recession, our base case is that it will be relatively mild, partly because many companies and investors have been anticipating a recession. Amid this build up, some companies, especially tech, have already laid off workers and slowed hiring, which help to loosen the labor market and ease inflationary pressures.
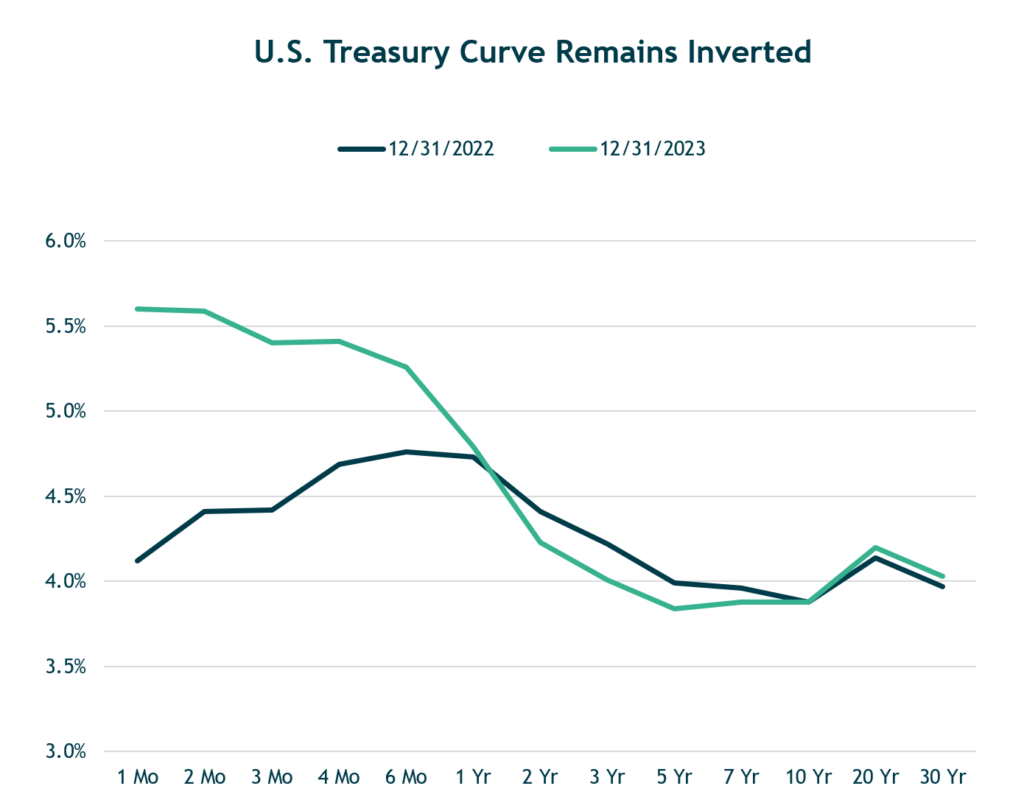
Source: U.S. Department of Treasury. Data as of 12/31/2023
Starting Bond Yields are Highly Correlated With 5-Year Total Returns
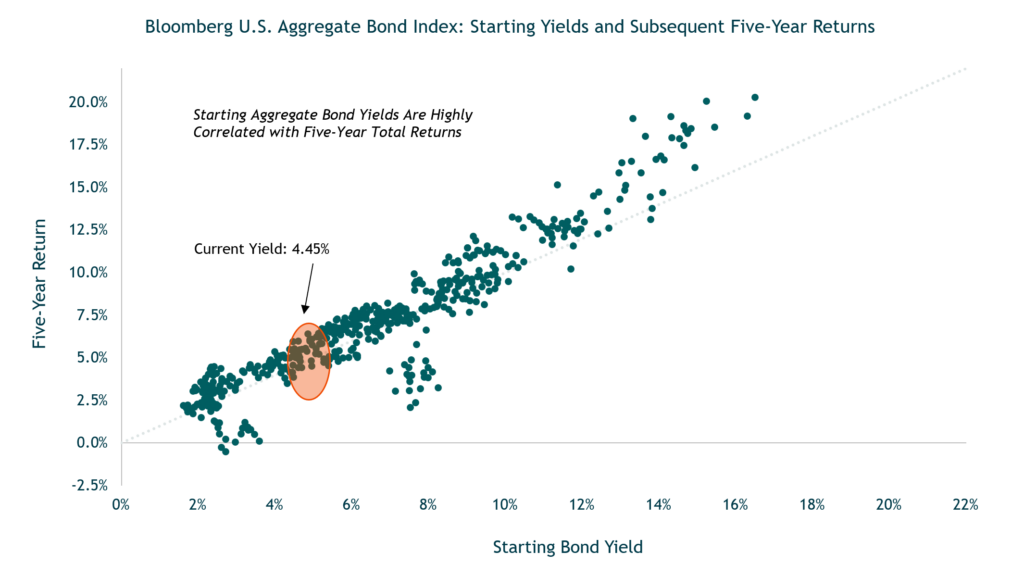
Source: Bloomberg LP. Data as of 12/31/2023.
Bond Yields and Expected Returns Have Increased Meaningfully
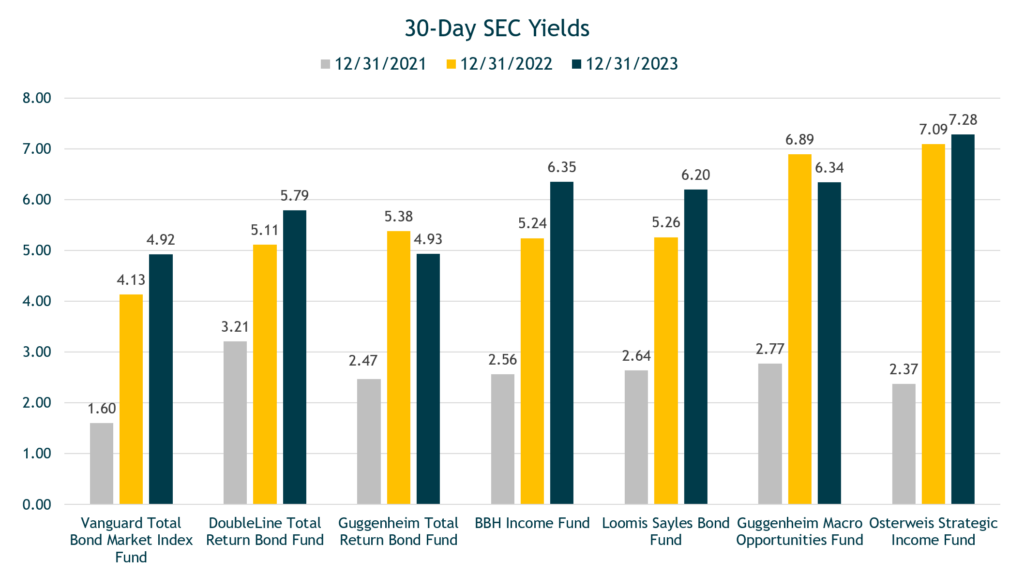
Source: Morningstar Direct. Data as of 12/31/2023.
Historically, Fed Tightening Cycles Lead to Recession
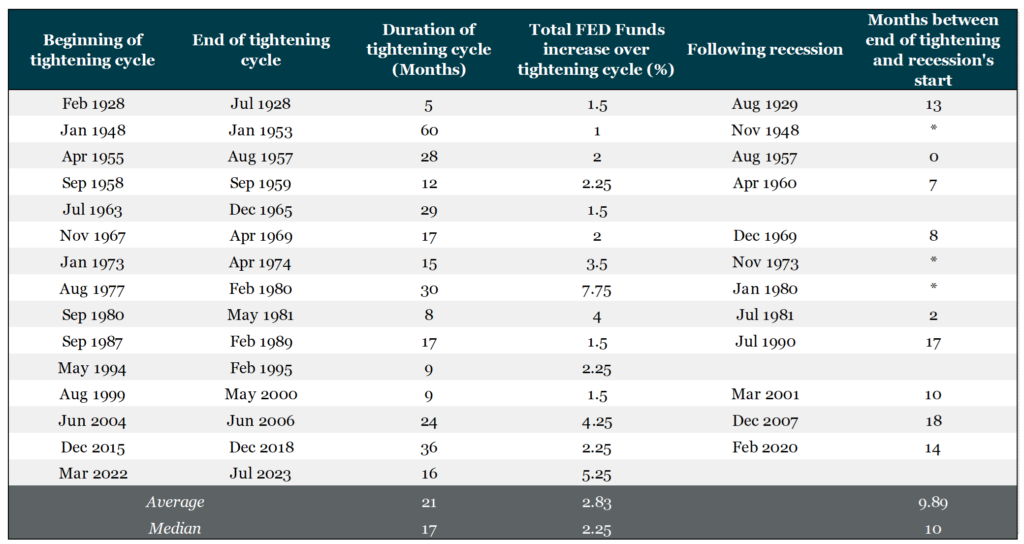
Source: Board of Governors of the Federal Reserve System, IMF, National Bureau of Economic Research (NBER).
Owning/Buying U.S. Stocks After a 25% Market Decline Typically Pays Off for Longer-Term Investors
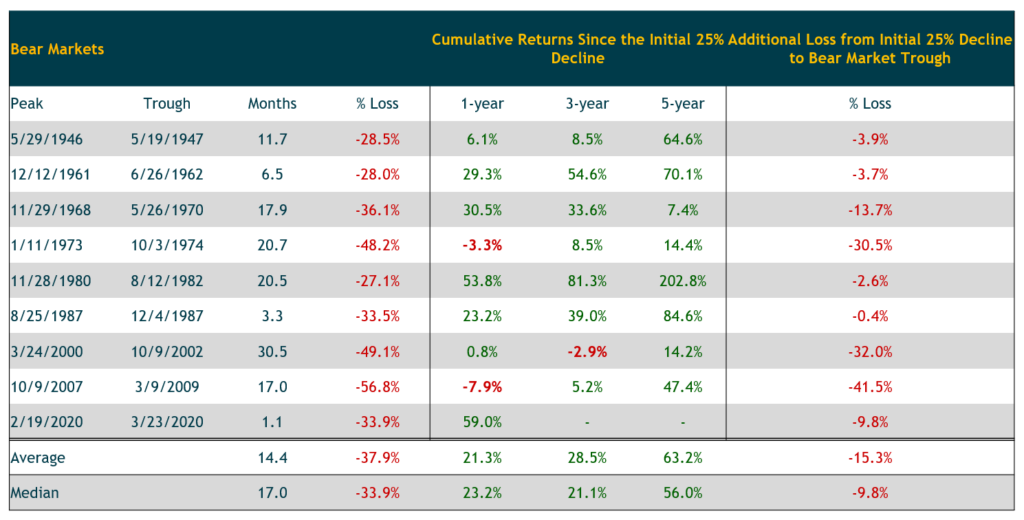
Source: Morningstar Direct. Data is for the S&P 500 Index. Data as of 12/31/2023.