Market Review
- U.S. Larger Cap stocks (S&P 500 Index) reached 57 new highs in 2024 on its way to a 25% total return. It was the S&P’s second year in a row of over 20% gains. Growth-oriented stocks (Russell 1000 Growth Index) led by technology names, particularly NVIDIA and Broadcom, were the biggest winners, posting a 33.4% gain. Value-oriented stocks (Russell 1000 Value Index) were up 14.4% in comparison, while smaller-cap U.S. stocks ended the year positive 11.5%.
- Overseas, returns were not as strong. Developed international stocks (MSCI EAFE) posted a modest 3.8% gain. Calendar-year returns for most foreign markets were dragged down by fourth-quarter losses following the Trump presidential victory, which sparked fears of a widespread economic slowdown due to tariff risks and a stronger U.S. dollar. Emerging markets stocks (MSCI EM Index) had a volatile year, finishing the year up 7.5%.
- Yields on the 10-year treasury rose nearly 100bps in Q4 resulting in steep losses for the interest rate sensitive Bloomberg U.S. Aggregate bond index. For the full year, the index managed to eek out a 1.3% return. Performance was much better for the credit-sensitive sector of the bond market with High-yield bonds (ICE BofA Merrill Lynch High Yield Index) ending the year up over 8%.

Performance reflects index returns as follows (left to right): Bloomberg US Aggregate, ICE BofA US High Yield, S&P 500, Russell 2000, MSCI EAFE, MSCI EM, Morningstar US Fund Multistrategy Index, SG Trend Index. Source: Morningstar Direct. Data as of 12/31/2024.
The Fed Cut Rates 100bps in 2024, but Fewer Cuts Now Expected in 2025
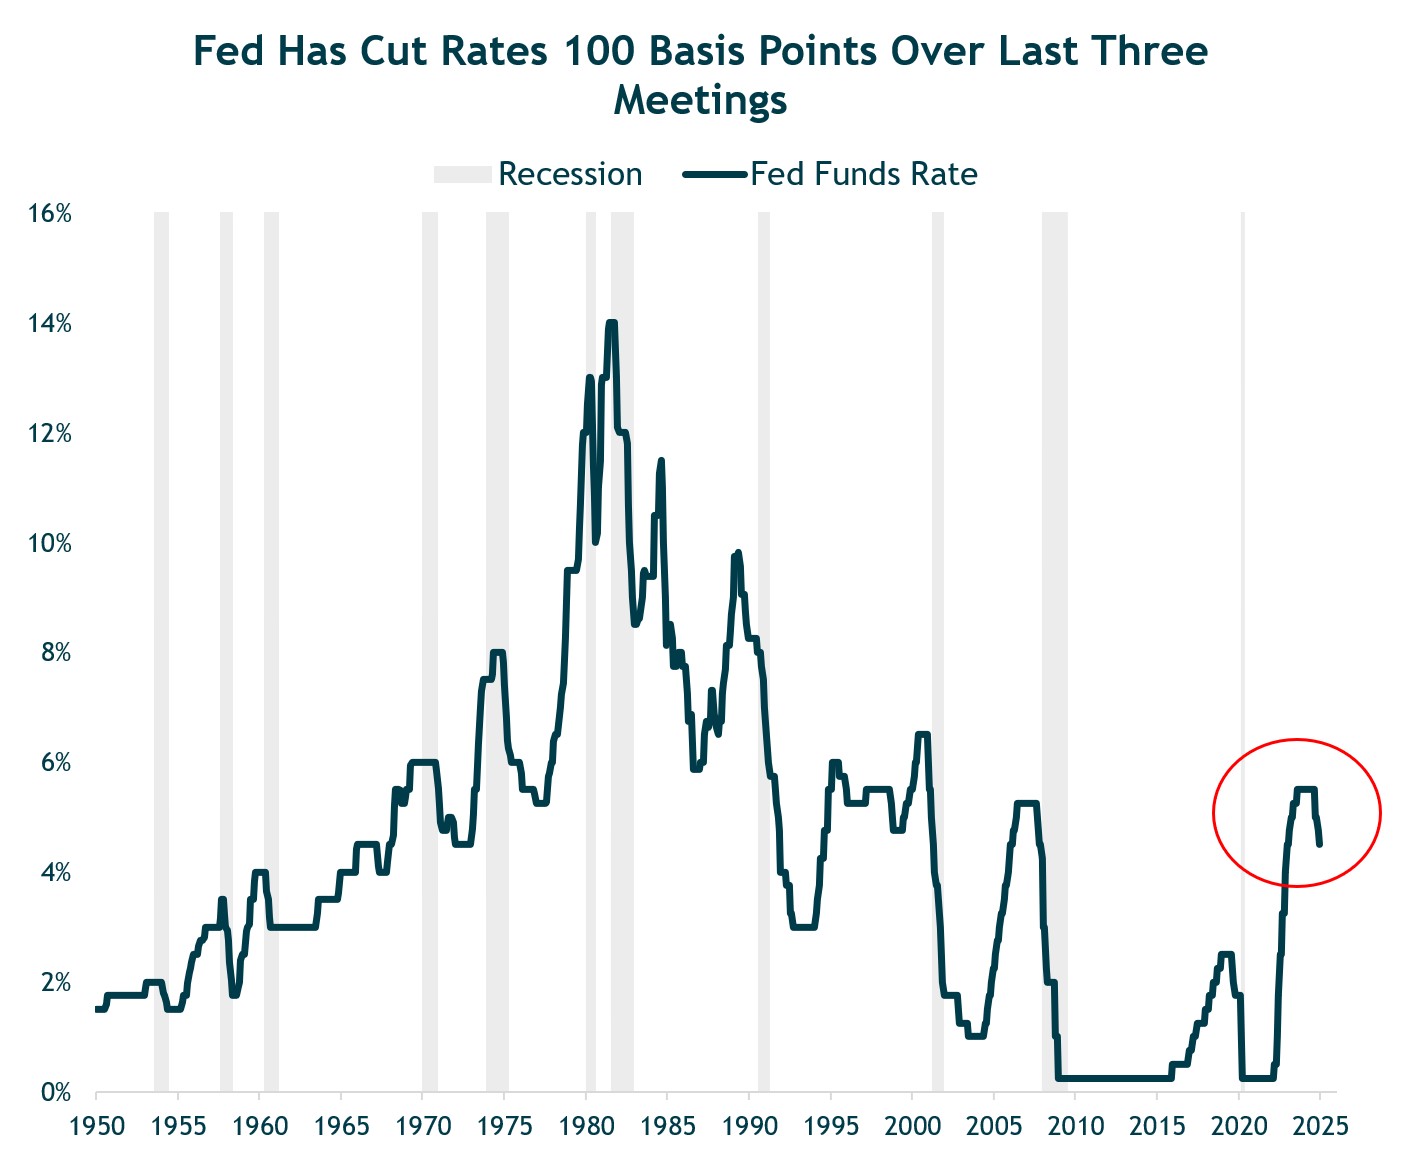
- Renewed concerns over inflation imply few rate cuts in 2025.
- The number or rate cuts for 2025 were dialed back from September’s four 25 basis point rate cuts to only two rate cuts, implying a year-end 2025 level of 3.9%, up from 3.4%.
- Similarly, the Fed funds projection for 2026 increased from 3% to 3.4%.
Source: Board of Governors of the Federal Reserve System. Data as of 12/31/2024.
2024 Was a Volatile Year for the Bond Market
- Throughout 2024 the bond market (as illustrated by the 10-year Treasury yield) has been hyper-focused on every economic data release, ranging from inflation and employment reports to GDP growth and consumer strength.
- Each datapoint has been heavily scrutinized for its potential impact on central bank policy, driving heightened volatility as investors attempt to project the likelihood of interest rate changes and the implications on returns.
- Investor guesswork has led to a very volatile year for the 10-year U.S. Treasury bond, reflecting the market’s sensitivity to economic conditions in an uncertain environment.
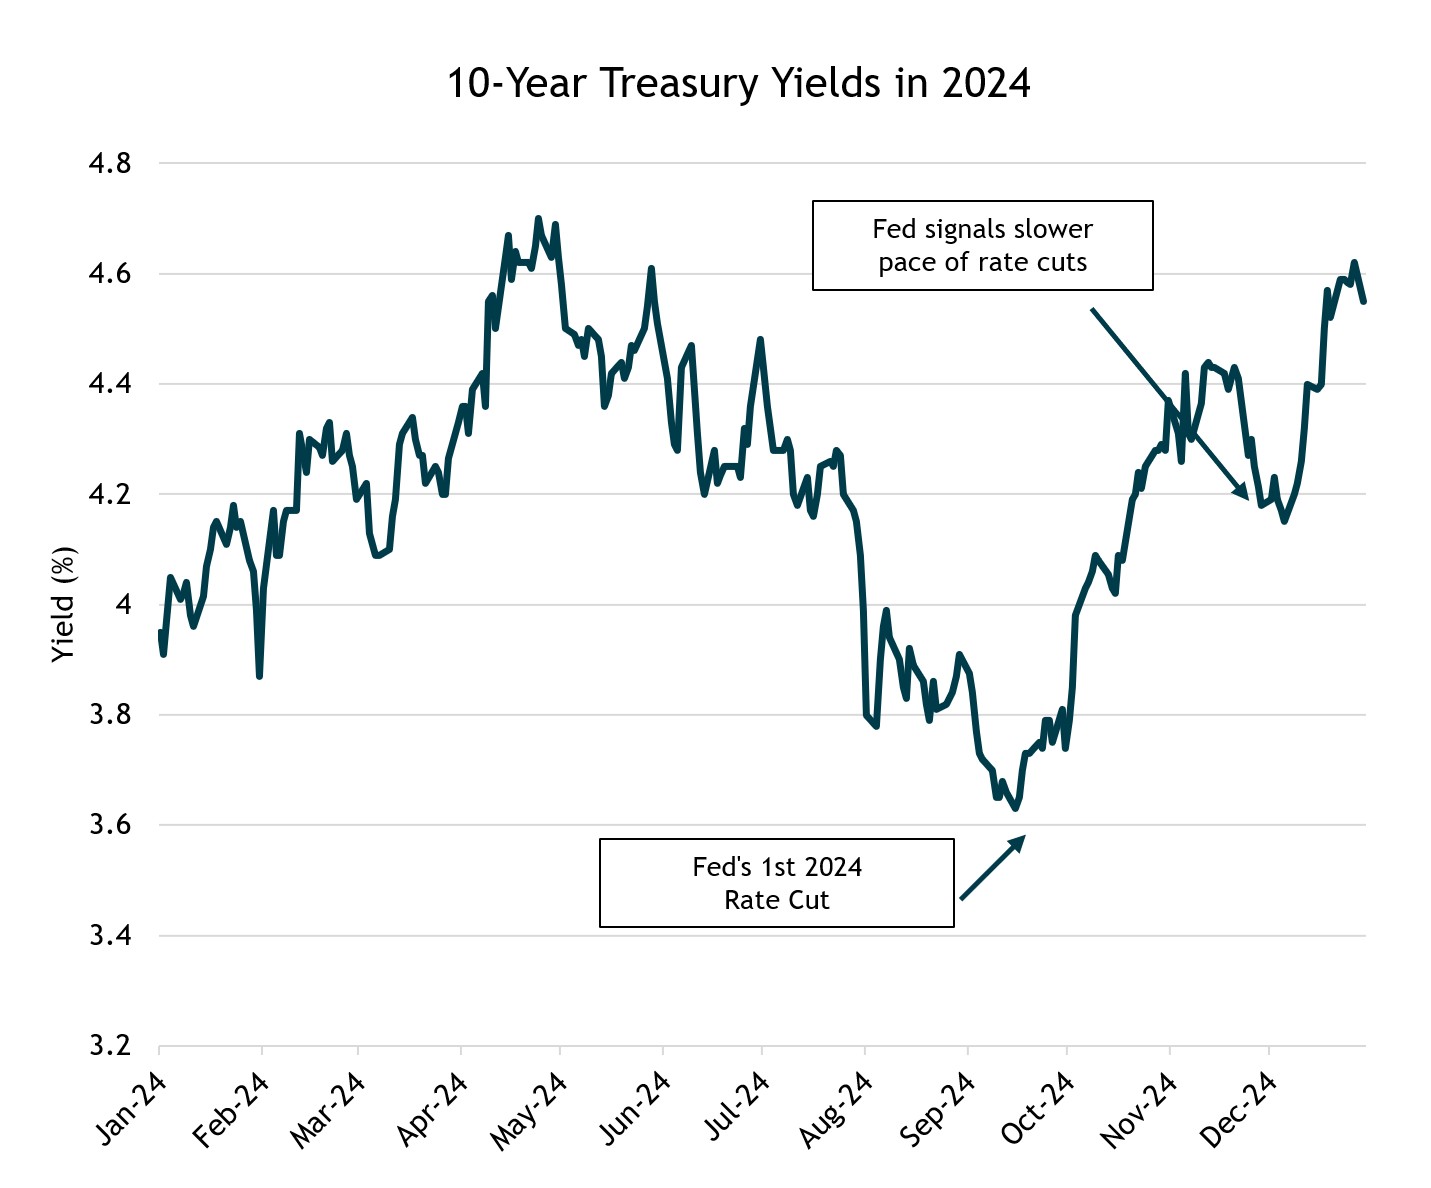
Source: Federal Reserve. Data as of 12/31/2024.
Starting Bond Yields are Highly Correlated With 5-Year Total Return
- Our portfolios have meaningful exposure to many of these strong-performing mega-cap stocks, which has benefitted portfolio performance. But we remain balanced, also owning larger-cap value and smaller-cap U.S. stocks that are trading at more attractive valuations and offer important diversification benefits.
- In March, we rebalanced our U.S. equity allocation to increase exposure towards higher-quality, more attractively valued parts of the U.S. equity market (value stocks and smaller-cap stocks) that could benefit from an ongoing economic expansion and a broadening out of the market rally.
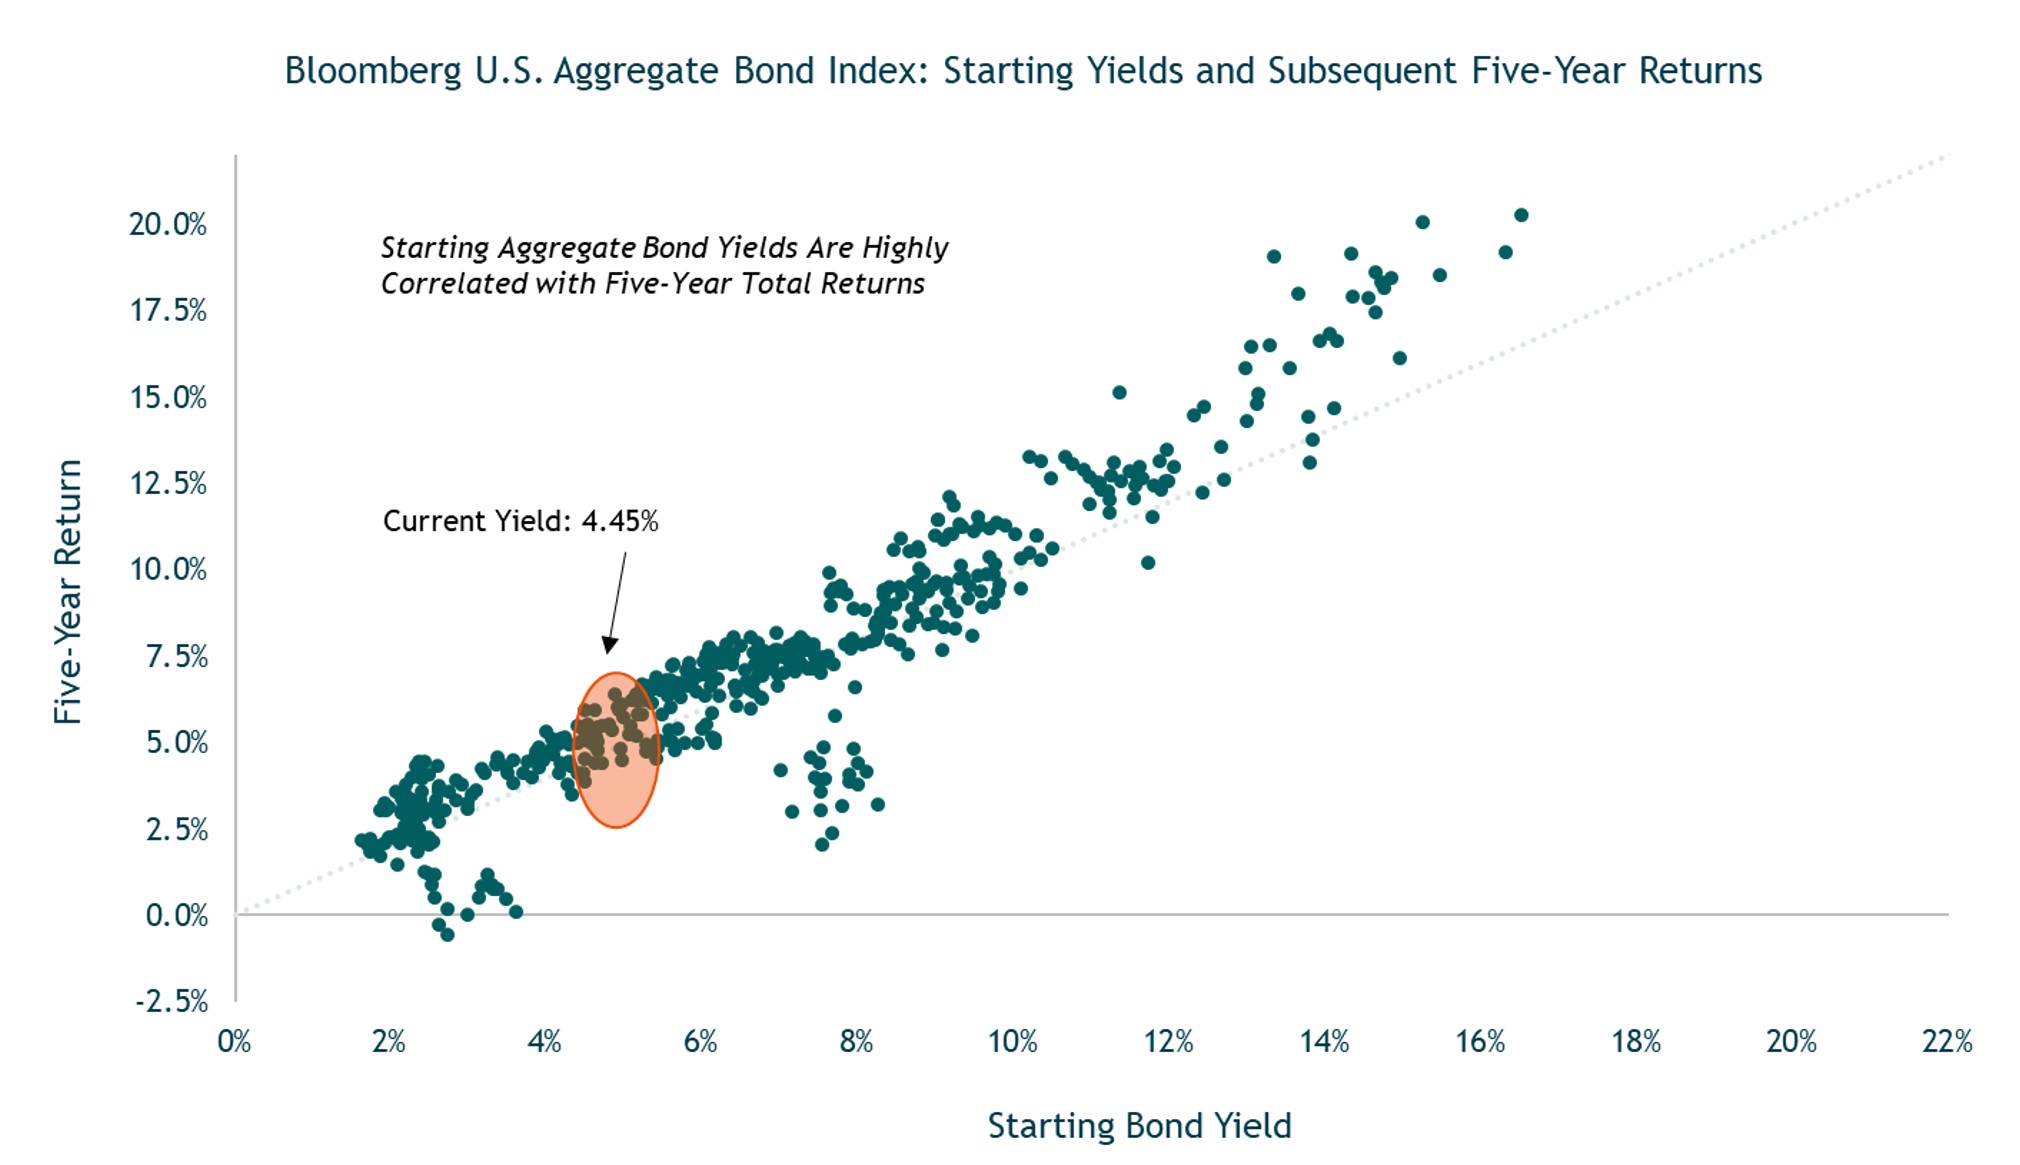
Source: Bloomberg LP. Data as of 12/31/2024.
The Decline in Inflation Stalled in the Fourth Quarter
- Our view since early this year has been that inflation was under control and that it would be trending lower in the second half of the year.
- The decline in inflation gave the Fed the confidence to lower the Fed Funds rate by 50bps at their September FOMC meeting.
- But a renewed focus on inflation at it’s December meeting implies fewer rate cuts in 2025 and 2026.
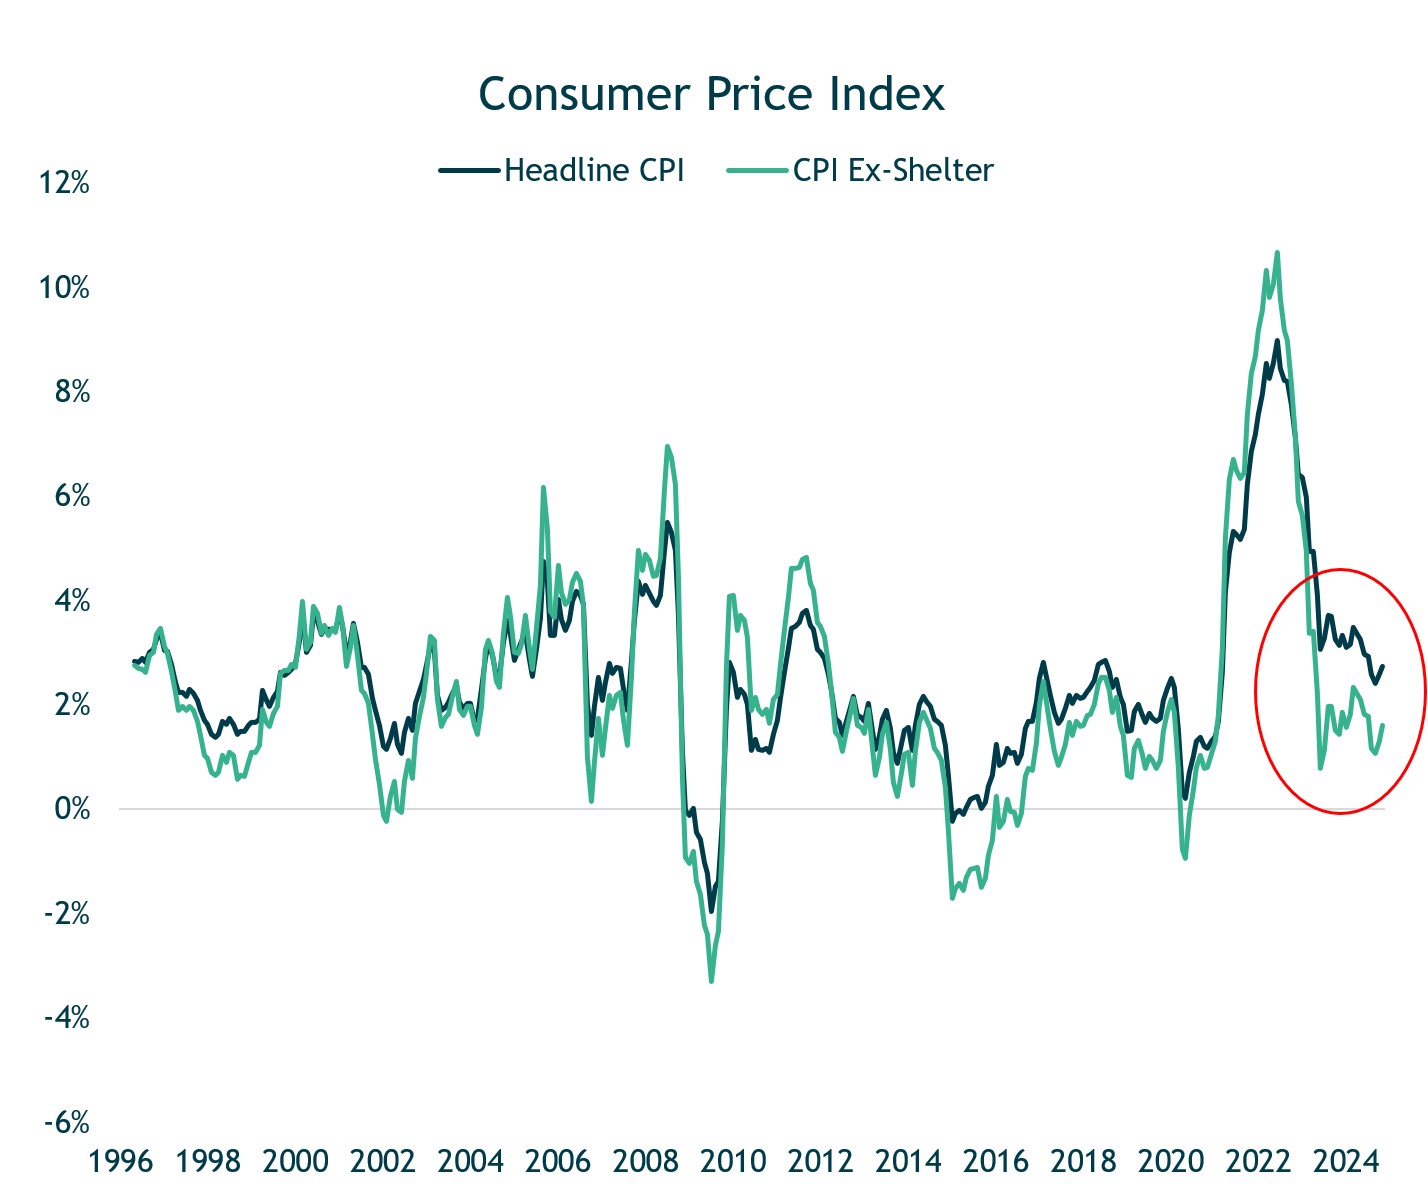
Source: Federal Reserve Economic Data. Data as of 11/30/2024
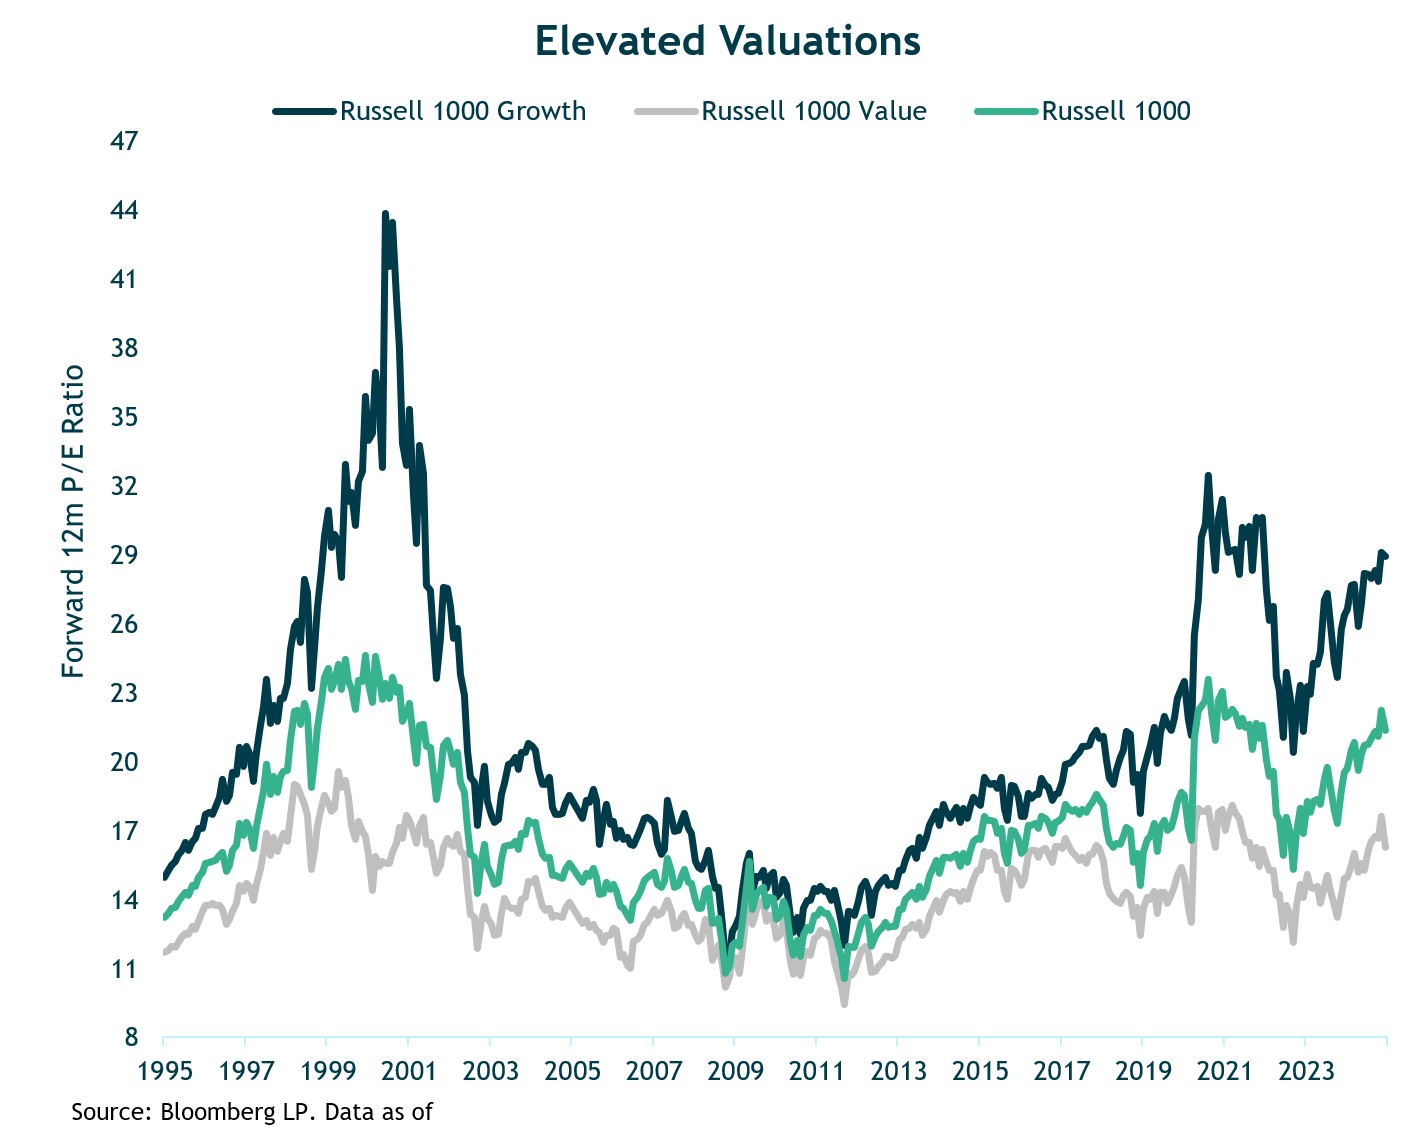
U.S. Large Cap Stock Valuations – Particularly Large Growth – Remain Elevated Making Future Gains Harder to Come By
- The price you pay to own stocks matters. After several years of very strong performance, U.S stocks – particularly U.S. large cap growth stocks – are trading at expensive valuations making future gains harder to come by.
- We believe for the rally in stocks to continue, it must be joined by other areas of the market that haven’t performed as well, such as large-cap value stocks, and mid-and-small cap stocks.
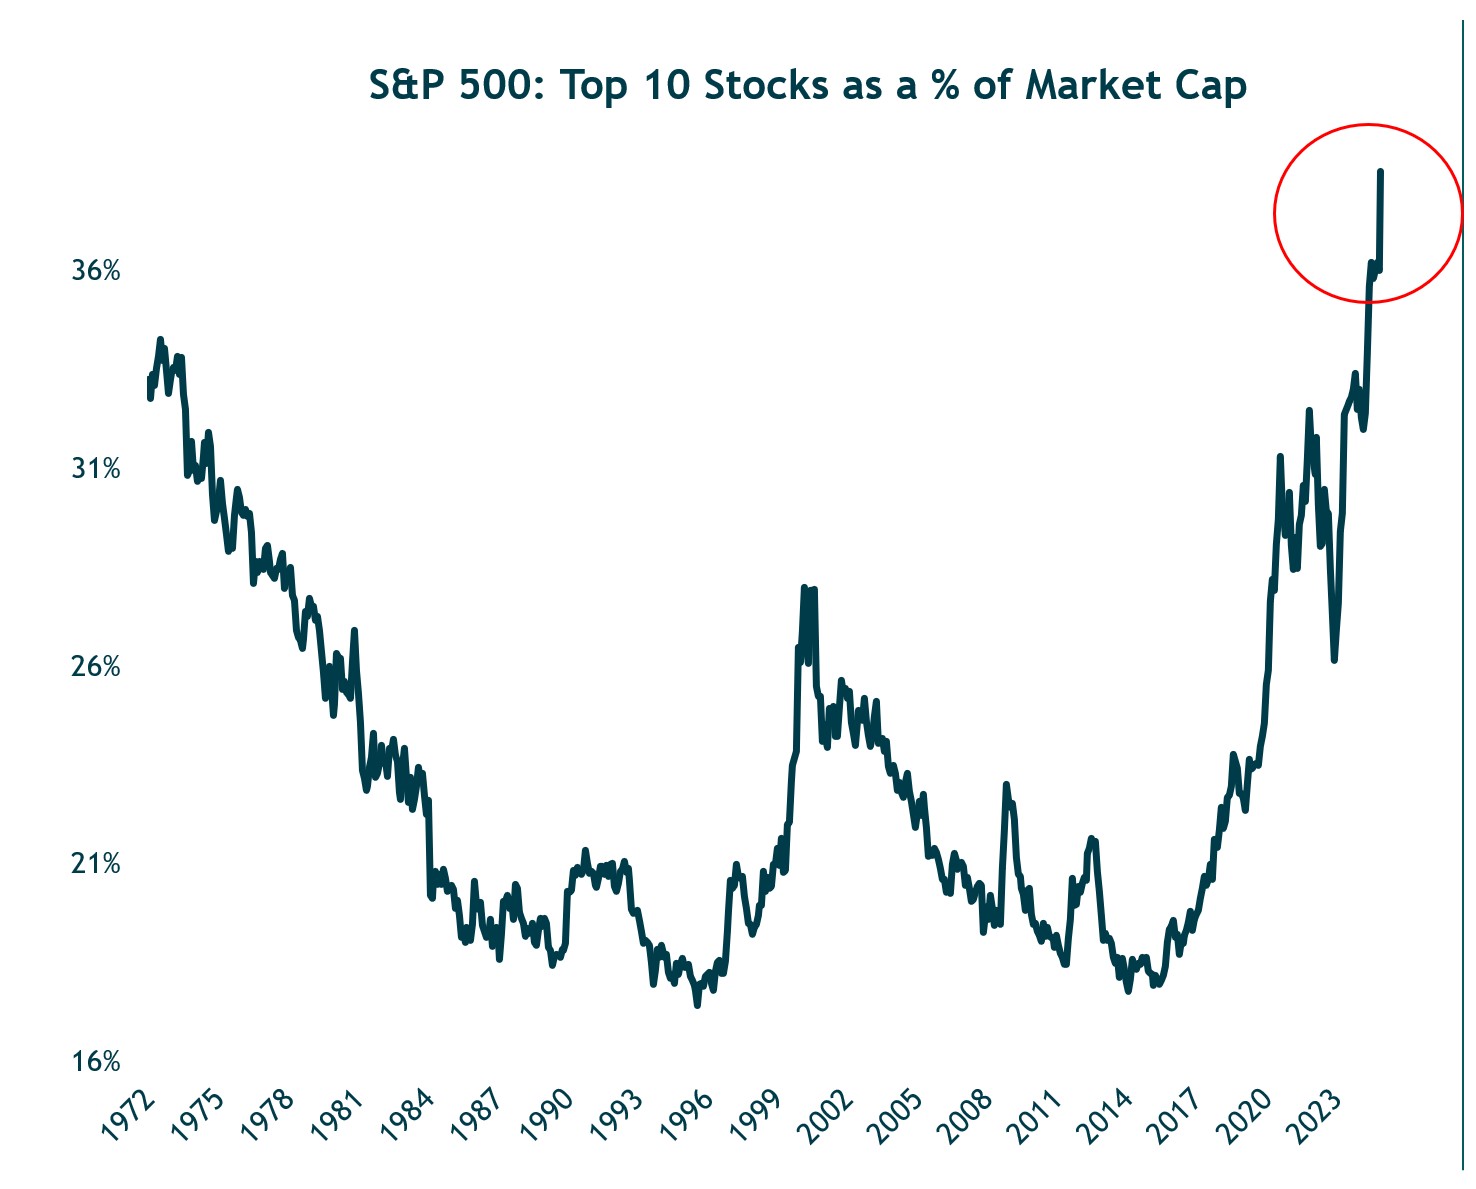
The Weight of the Top-10 Stocks in the S&P 500 have Reached an All-Time High
- The strong performance of large-cap growth stocks in recent years has resulted in one of the most concentrated stock markets on record.
- There are now 8 companies in the S&P 500 valued at greater than a trillion dollars, and the weight of the top-10 stocks in the index has reached an all-time high of 39%.
- While this narrow market leadership could persist for some time, the top stocks can’t lead the market higher into perpetuity. The rest of the index must join for a healthy bull market to continue.
- Otherwise, failure of a few companies to meet extremely optimistic expectations will drag down market cap weighted indexes (like the S&P 500).
Source: Ned Davis Research. Data as of 12/31/2024.
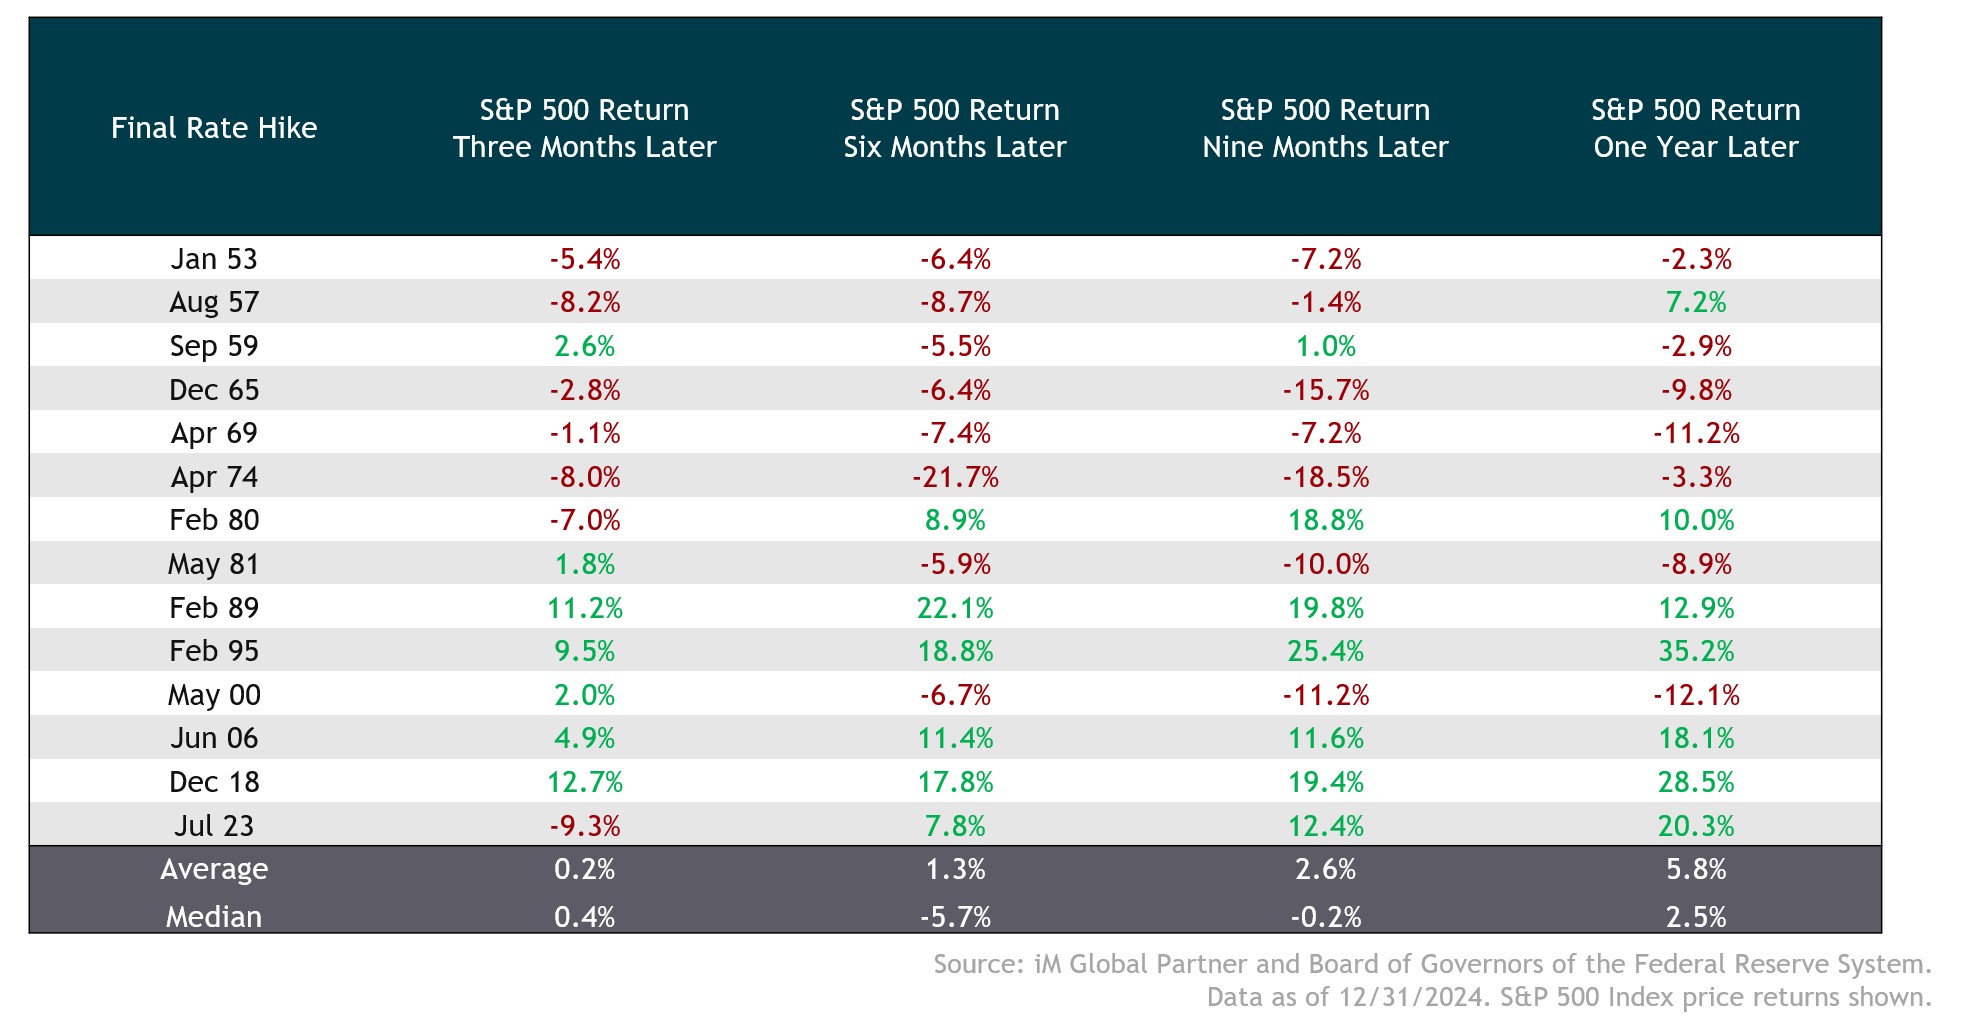
Following a Fed Tightening Cycle Equity Returns Have Generally Been Positive in Lower Inflation Environments
- When inflation is not elevated, the Fed can move to a more accommodative stance much sooner, which has generally been positive for equities. This can be seen in the post 1980’s in terms of the much shorter time between the final rate hike and the subsequent rate cut.
- Most of the negative outcomes occurred during bouts of elevated inflation (particularly through the 60’s and 70’s). Because of higher inflation, the Fed will typically maintain a more restrictive policy – i.e., it will take them longer to pivot and cut rates (higher for longer).
Historically Stocks Have Trended Higher Regardless of the Political Party in Office
- With the U.S. presidential election having just been completed, we want to reiterate our long-held view that portfolio positioning should be guided by an analysis of longer-term risks and rewards, not election outcomes.
- We recognize that it’s natural for investors on both sides of the aisle—especially in today’s polarized environment—to believe that an election outcome could have a big impact on the financial markets.
- This intuition, however, is not supported by the historical data and we provide some evidence below that stocks have historically trended higher regardless of the political party of the President.
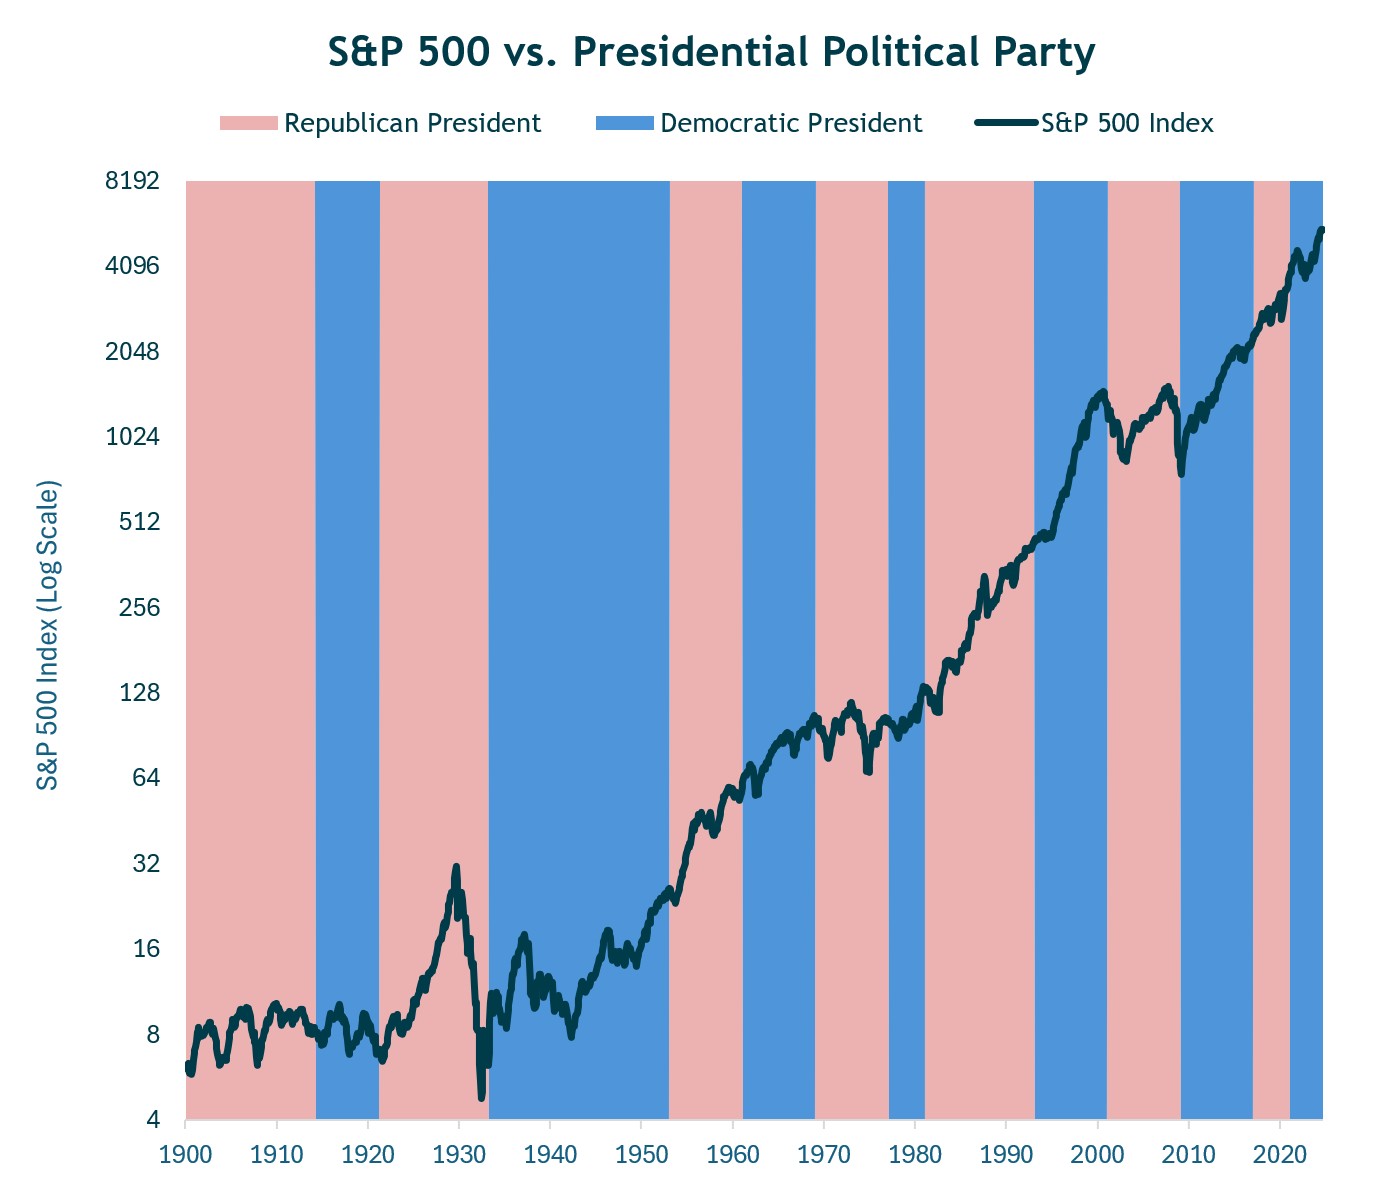
Source: Bloomberg. Data as of 12/31/2024.
Asset Class Returns By Presidential Term
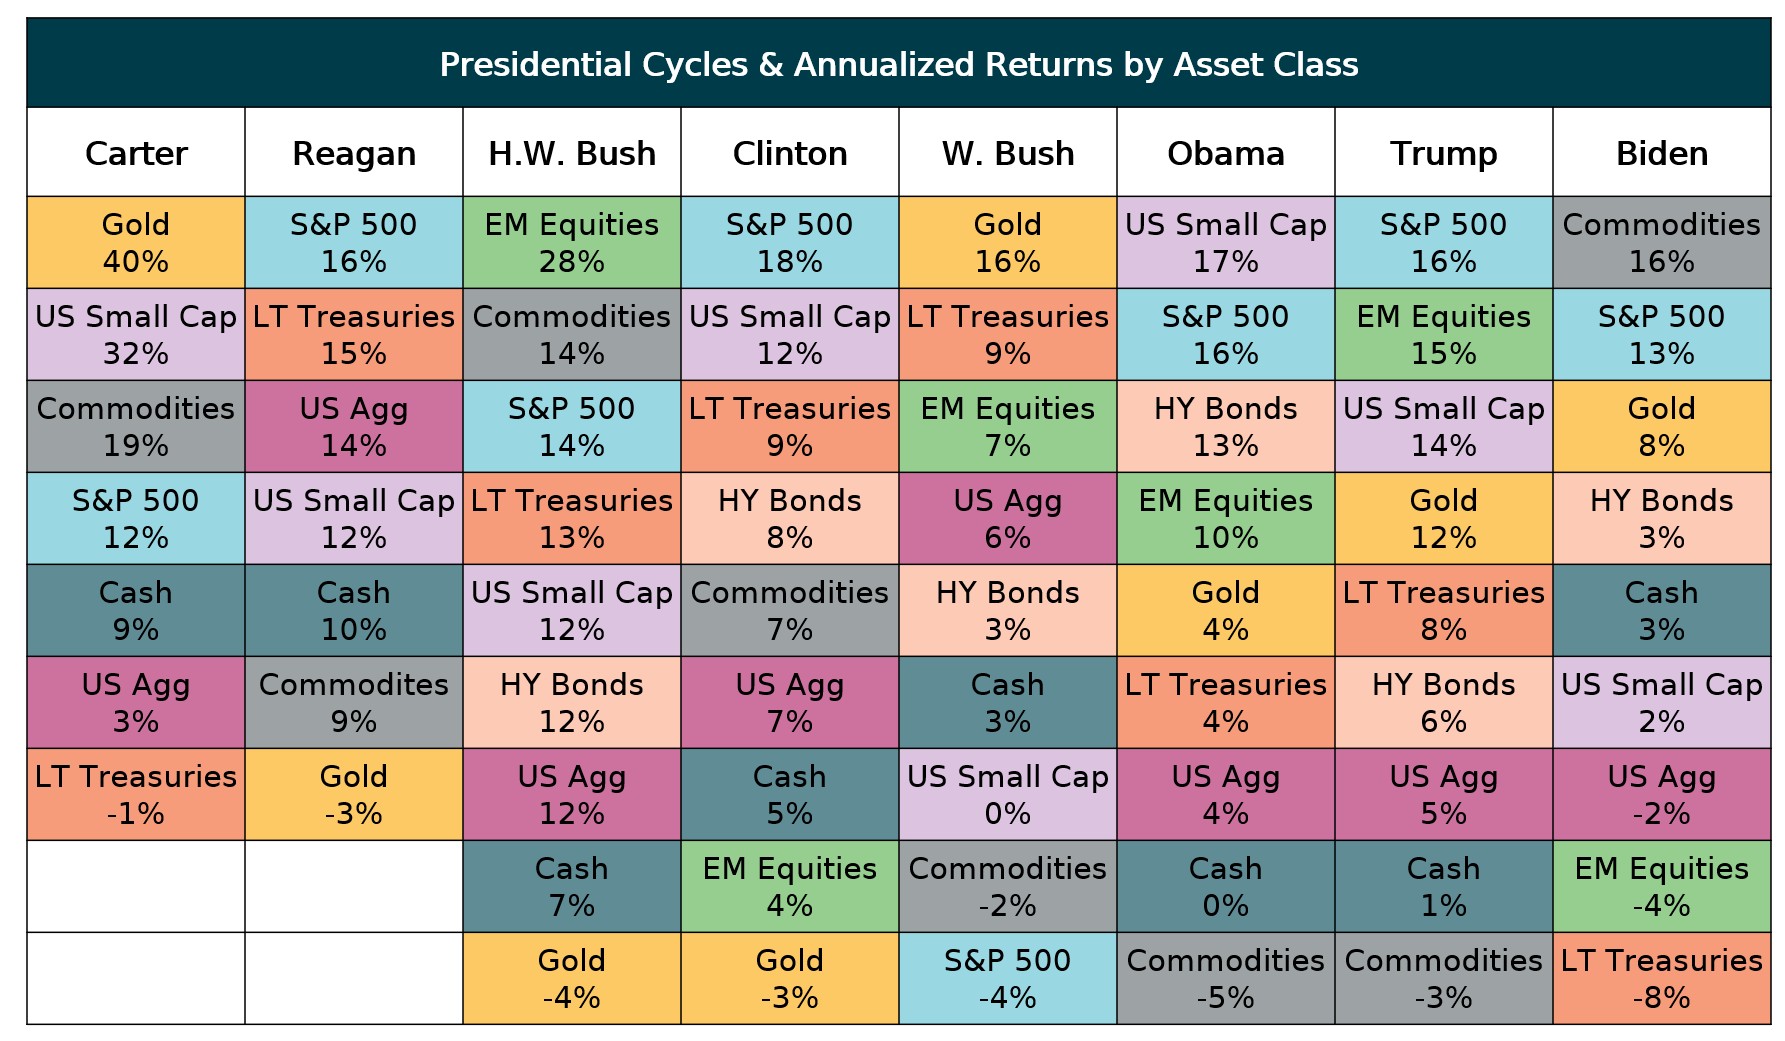
Source: Richard Bernstein Advisors. Data as of 12/31/2024.