Market Review
- U.S. Stocks (S&P 500 outpaced foreign Index) underperformed foreign stocks in the first quarter. U.S. large-cap stocks trailed during January and February but have stocks (MSCI ACWI ex. U.S. Index) since the Iranian conflict started at the end of February. Much of the decline in stocks so far has come from multiple compression with earnings expectations remaining in the double-digits for the year.
- International stocks outperformed U.S. stocks over the full quarter but were not immune to the March drawdown. Developed market stocks (MSCI EAFE) were up double-digits through February but gave most of that back in March to finish with a first quarter loss of 1.2%. Emerging markets (MSCI EM) performed relatively better with a small loss of 0.2% in the quarter.
- After cutting rates three times last year, the Federal Reserve held rates steady at their two meetings so far in 2026. Since the onset of the war, additional cuts in 2026 have been priced out of market expectations. Both investment-grade core bonds (Bloomberg US Aggregate Bond Index) and high-yield bonds (ICE BofA US High Yield) finished the quarter essentially flat.
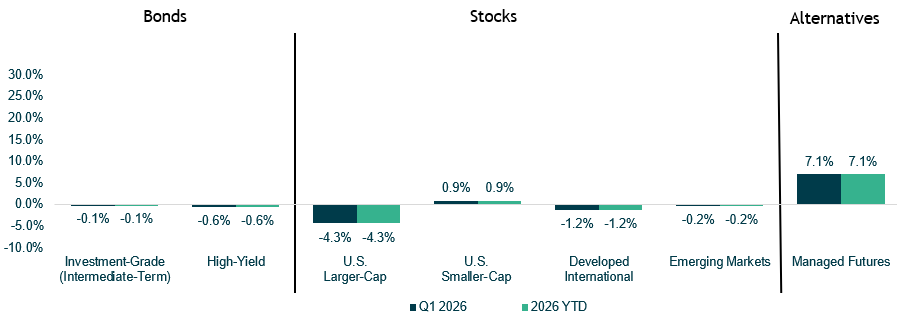
Performance reflects index returns as follows (left to right): Bloomberg US Aggregate, ICE BofA US High Yield, S&P 500, Russell 2000, MSCI EAFE, MSCI EM, SG Trend Index. Source: Morningstar Direct. Data as of 3/31/2026.
Returns since start of Iran conflict
- U.S. Stocks (S&P 500 Index) helped up relatively better since the start of the war. A stronger U.S. dollar (up 2.4%) in March contributed to some of this—with another likely explanation is that the U.S. is not as reliant on Middle East oil imports as other countries.
- Concerns about increased inflation from higher energy costs caused rates to back up during March. Bonds also faltered alongside equity prices in March, as U.S. core bonds fell 1.8%.
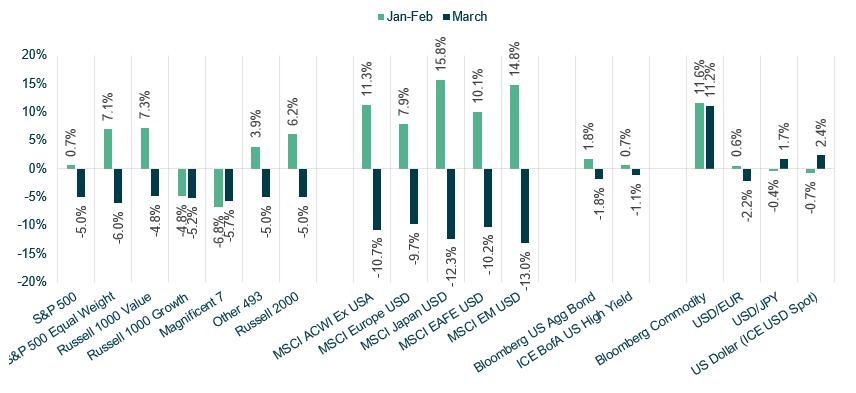
Source: Morningstar Direct. Data as of 3/31/2026.
Strait of Hormuz remains effectively closed despite recent ceasefire
- The recent (fragile) ceasefire has allowed some tankers to transit the Strait, however, traffic through this key chokepoint remains well below where it was prior to the conflict.
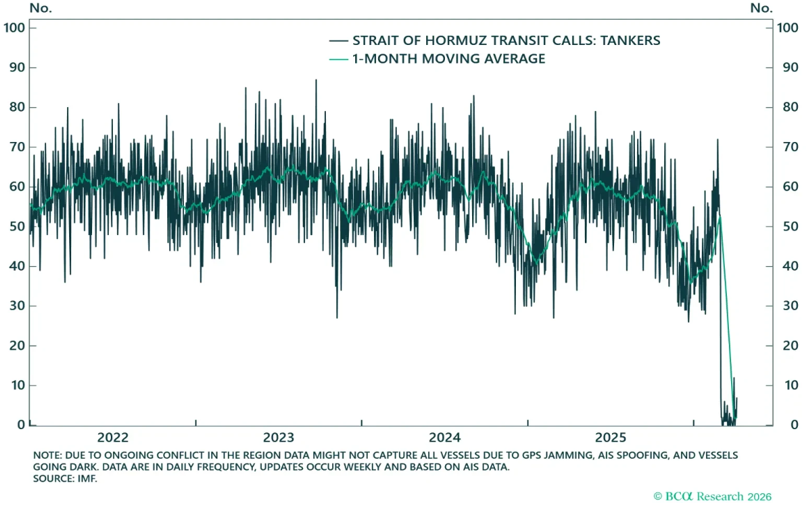
Source: BCA Research. Data as of 4/10/2026.
Oil prices have spiked with Strait of Hormuz effectively closed
- Oil prices spiked during the Russia/Ukraine war in 2022—preceding the jump in inflation.
- However, energy costs were not the sole contributor to the rise in inflation in 2022.
- Extraordinary fiscal stimulus, broken supply chains, a hot labor market, and record low interest rates also contributed to inflation during that period.
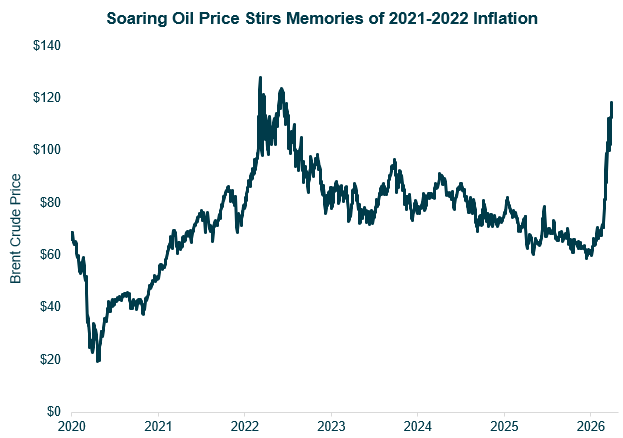
Source: Bloomberg LP. Data as of 3/31/2026.
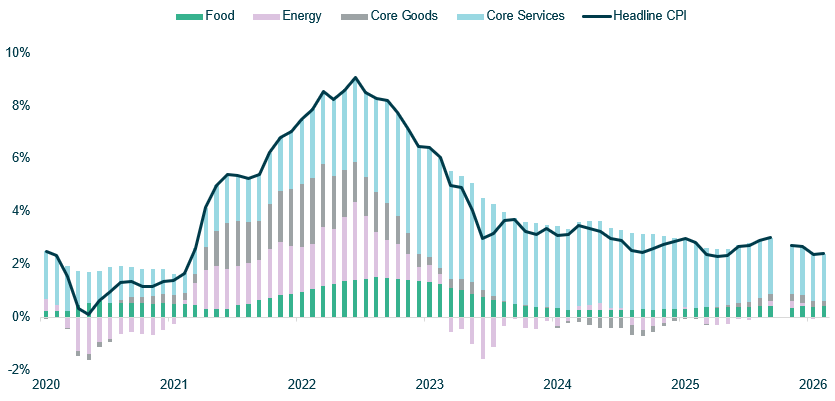
Goods and services are the larger drivers behind inflation
- Fed research shows higher energy costs added roughly half a percentage point to inflation in 2022. There were many contributing factors to the 9% inflation reading in 2022.
- The energy basket within headline CPI is roughly 6%—representing a modest share of the overall calculation.
Source: Bloomberg LP. Data as of 2/28/2026.
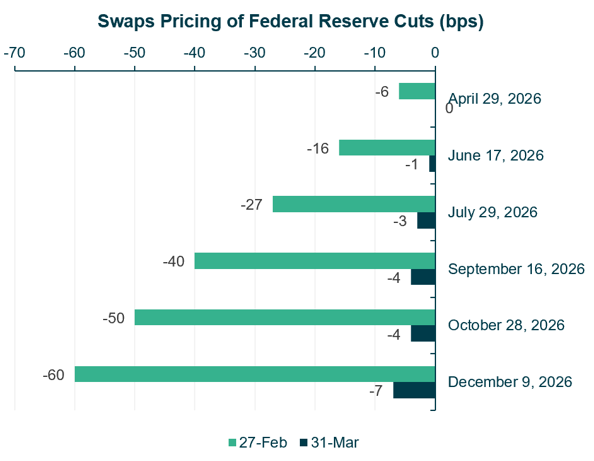
Higher inflation expectations have reduced expectations for Fed easing
- Energy-driven inflation fears rattled global bond markets, sending U.S. rates up 35–45 basis points in March.
- Markets have sharply repriced central bank expectations, with investors now expecting no Fed rate cuts this year—down from two cuts anticipated at the end of February.
Source: Bloomberg LP. Data as of 3/31/2026.
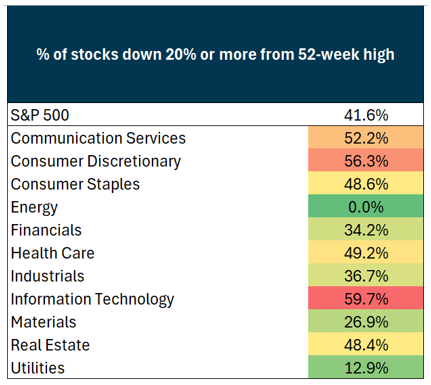
Despite a single-digit decline in the S&P 500, there is a lot of divergence under the hood
- More than 40% of stocks inside the S&P 500 are down 20% or more from their 52-week high.
- The divergence is most evident within technology stocks with nearly 60% of stocks in a bear market.
- Within the technology sector, software names have sold off amid concerns around AI breakthroughs that could disrupt their business models.
Source: Bloomberg LP. Data as of 3/31/2026.
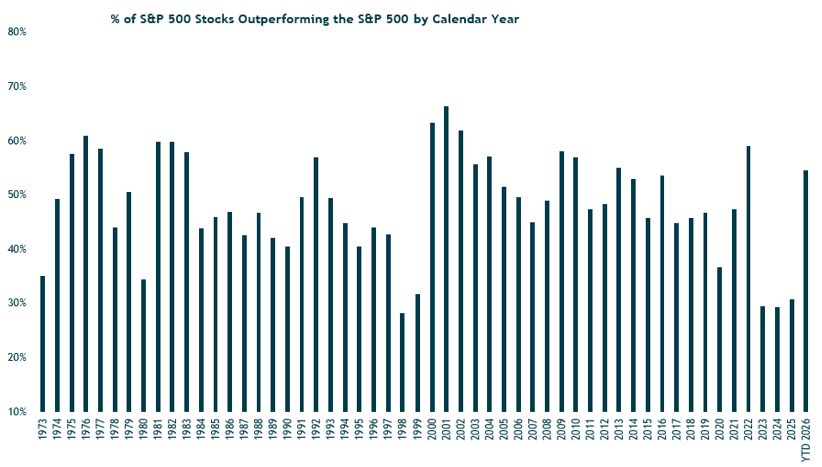
Greater share of S&P 500 constituents outperforming this year
- After three calendar years of only ~30% of stocks in the S&P 500 outperforming, more than half of stocks in the index are performing better than the index.
- This has been aided by the trend in favor of equal-weighted indexes over market-cap indexes, value stocks beating growth stocks, and smaller-cap companies outperforming this year.
Source: Ned Davis Research. Data as of 4/10/2026.
Growth underperformance has narrowed valuation premium
- Growth stocks typically always trade at a premium to value stocks, but this gap has been cut in half in recent months.
- So far, the majority of the damage has been valuation compression rather than downward earnings revisions.

Source: Bloomberg LP. Data as of 3/31/2026.
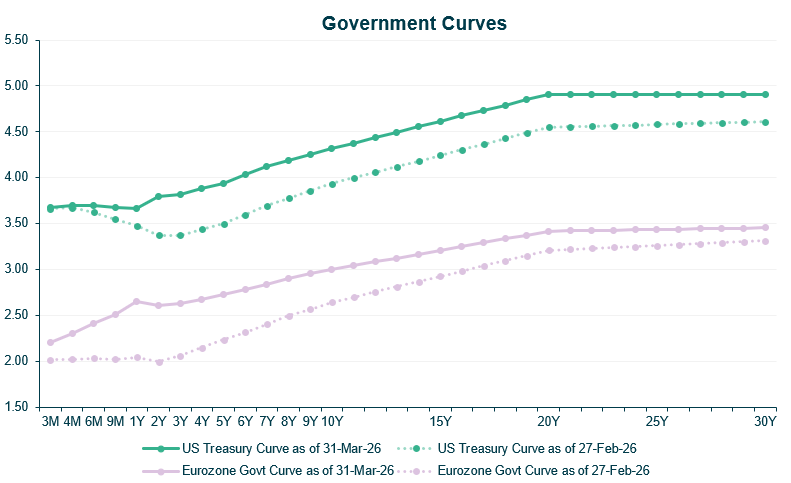
Concerns around energy inflation shifted yield curves higher during March
- The U.S. Treasury curve rose between 35 and 45 basis points since the Iranian war started. The 10-year U.S. treasury yield hit a high in March at 4.44% after being sub-4% in late February.
- There was a larger reaction at the front-end of the Eurozone curve. Their economy has much greater exposure to oil & gas shipped through the Persian Gulf.
Source: Bloomberg LP. Data as of 3/31/2026.