
Market Review
- The second quarter of 2026 was a sharp reversal of the first. Just three months ago, the first quarter had delivered a decline of 5% in the S&P 500. But what followed in the second quarter was a round trip in risk assets. The S&P 500 returned 10.5% in April, its best month since 2020, then added another 5.3% in May, closing the month at successive record highs. By the time the quarter ended (even after a choppy June), the S&P 500 had gained 15.2% for the three months and is now up 10.2% this year.
- The rotation extended into foreign equities. Emerging markets led the way, with the MSCI EM Index gaining roughly 24% for the second quarter, as the same memory and semiconductor demand driving Korea and Taiwan rewarded the markets most exposed to it. Developed international equities had solid absolute returns but failed to keep pace with other equity markets. The broad MSCI EAFE Index rose about 10.8%, while European stocks gained nearly 11% for the quarter and Japanese equities surged 14.2%.
- Fixed income offered its own version of the quarter’s round trip. The Federal Reserve made no change to the policy rate—the June meeting marked a fourth consecutive hold at 3.50% to 3.75%. The broad Bloomberg U.S. Aggregate Bond Index returned a modest 0.67% for the quarter. Credit stayed calm during the quarter with high yield bonds gaining 2.5% in the quarter as spreads held near multi-year tights.
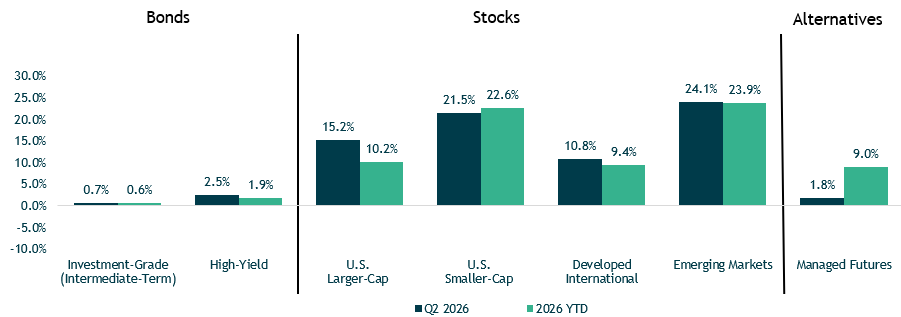
Performance reflects index returns as follows (left to right): Bloomberg US Aggregate, ICE BofA US High Yield, S&P 500, Russell 2000, MSCI EAFE, MSCI EM, SG Trend Index. Source: Morningstar Direct. Data as of 6/30/2026.
Conflict in Iran Remains in the headlines
- A loosely held ceasefire took effect in early April. Through the middle of the quarter, a Pakistan-mediated framework gradually took shape, culminating in a memorandum of understanding announced in mid-June.
- The market’s response was swift and one-directional. Brent crude, which had peaked at $118/barrel in late April, fell about 26% in May back into the mid-$80s. Oil prices fell further in June as the ceasefire framework took hold.

Source: Bloomberg LP. Data as of 6/30/2026.
Higher energy costs entering the data
- The inflation data released during the quarter told the story of the energy shock working through the system with its usual lag. By the time the conflict’s supply disruption was working through the inflation readings, the conflict itself was already de-escalating.
- Headline PCE accelerated to 4.1% year-over-year in May, the highest reading since April 2023, with the May producer price index rising 6.5% year-over-year, the steepest since late 2022. The Federal Reserve’s preferred gauge, the core personal consumption expenditures index, reached 3.4% year-over-year, the highest since October 2023.

Source: U.S. Bureau of Economic Analysis. Data as of 5/30/2026.
Difficult to overstate the amount of capital being invested into artificial intelligence
- The largest IT platform companies have earmarked nearly $850 billion dollars for capital expenditures over the next 12 months.
- Spend on AI infrastructure continues to outstrip expectations.

Source: Bloomberg LP. Data as of 6/30/2026.
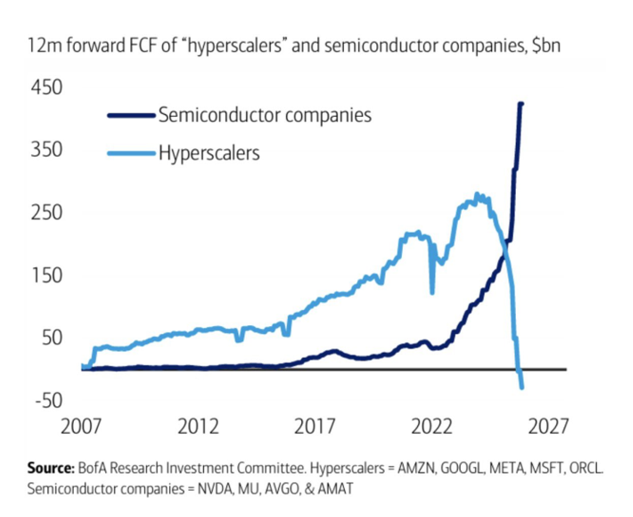
All that hyperscaler CAPEX is benefiting the bottom line of semiconductor companies
- NVIDIA, the AI spending poster child, reported $81.6 billion in revenues—up 85% from a year earlier.
- These are real revenues, real profits, and in most cases capital spending funded out of free cash flow rather than debt. However, significant equity and debt issuance from the hyperscalers during the second quarter marks a divergence from internal cash flows funding the CAPEX.
Source: BofA Global Research. Data as of 6/30/2026.
Tech weight in US and EM indexes continues to increase
- The tech sector weight in EM indexes has now surpassed the weight in the S&P 500.
- US and EM indexes are increasingly reliant on the AI/tech trade as concentration in the tech sector has increased meaningfully. Developed foreign equities, on the other hand, are much less tied to this trade.

Source: Morningstar Direct. Data as of 6/30/2026.
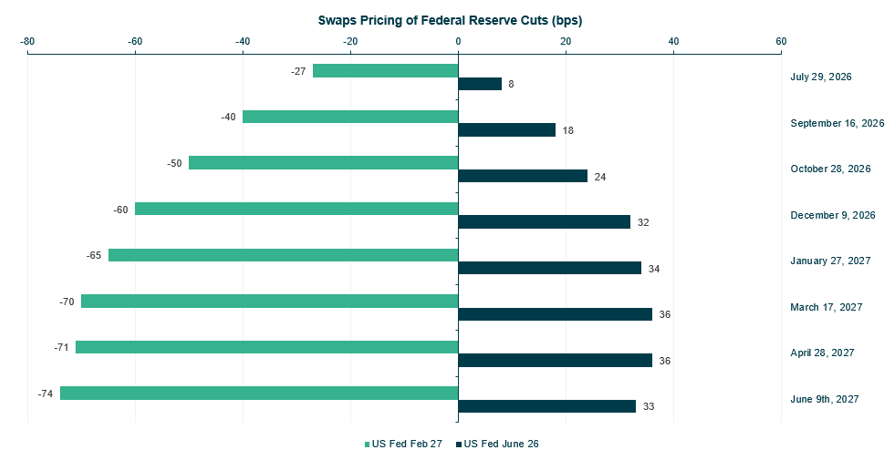
Interest rate expectations have moved from cuts to hikes
- Higher inflation numbers and a more hawkish Fed have flipped expectations for the Fed funds rate in 2026.
Source: Bloomberg LP. Data as of 6/26/2026.
Concerns around energy inflation shifted yield curves higher during march
- The bond market spent the second quarter telling a more cautionary story than the equity market.
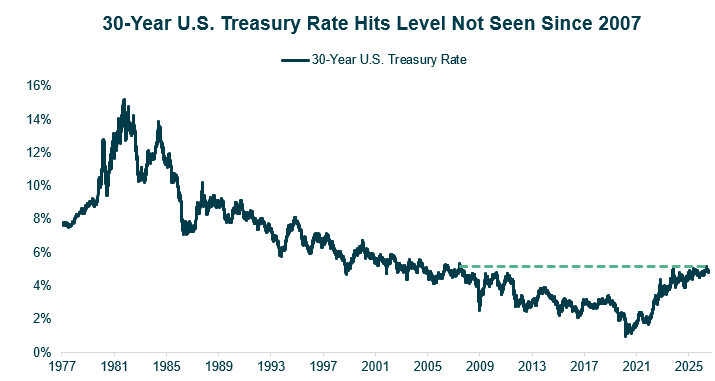
- In mid-May, the 30-year Treasury yield spiked to 5.18%, its highest level in 19 years, before easing back below 5% by the end of June.
- The move on the front-end of the curve, which tends to move with Fed funds rate expectations, moved slightly higher as it priced in a rate hike instead of cuts.
Source: Board of Governors of the Federal Reserve System. Data as of 3/31/2026.
Cuts priced out of the short end of the US treasury curve
- The move on the front-end of the curve, which tends to move with Fed funds rate expectations, moved higher as it priced in a rate hike instead of cuts.

Source: Bloomberg LP. Data as of 6/30/2026.
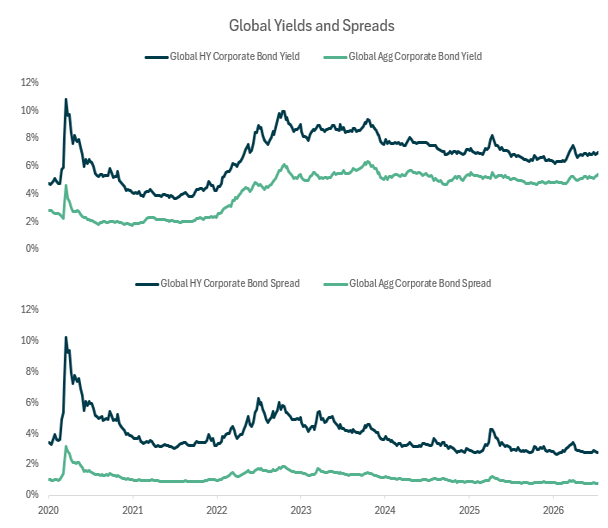
Yields remain attractive while spread are near multi-year tights
- Credit markets remain strong, with investment grade and high-yield spreads below historic averages.
- After a small blip around the end of the first quarter, spreads have narrowed again.
- We continue to like credit – over the past several years, many companies have delivered, extended maturities, and improved balance sheet quality, leaving them in a stronger position to withstand higher rates and slower economic growth.
Source: Bloomberg LP. Data as of 7/13/2026.