
Market Review
- The S&P 500 gained 2.3% in the third quarter, closing the quarter at 7,652, with record highs set along the way. Despite hitting record highs, U.S. stocks largely traded sideways over the summer. Despite the narrow range of the broader index, sector returns diverged in the quarter—energy, technology and communication services were the only positive sectors, while the others were down mid-single digits in the quarter.
- Foreign equities underperformed in the quarter—as both developed international and emerging markets were basically flat during over the summer months. A stronger U.S. dollar over the quarter was a headwind for European equities. However, Japanese stocks outperformed in dollar terms (up 6%) thanks to a stronger Yen over the quarter. Emerging-markets fell slightly in the quarter, but remain up over 23% on the year.
- The quarter’s real story was in the bond market: the Federal Reserve delivered its first hike in more than three years, the 10-year Treasury yield closed the quarter at 5.29%, near its highest since 2007. The 30-year reached 5.63%, its highest level since 2002. The rise in rates resulted in core bonds falling 3.5% over the quarter—the index’s worst quarter since 2022.
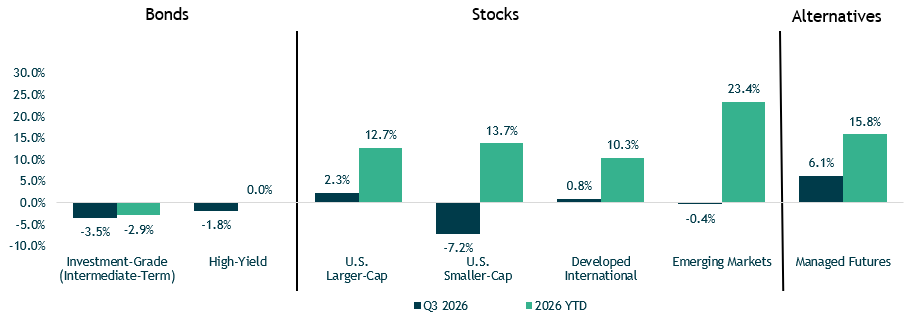
Performance reflects index returns as follows (left to right): Bloomberg US Aggregate, ICE BofA US High Yield, S&P 500, Russell 2000, MSCI EAFE, MSCI EM, SG Trend Index. Source: Morningstar Direct. Data as of 9/30/2026.
Headline index return covers up sector dispersion
- Narrow leadership: Only two of the 11 sectors are beating the S&P 500’s 12.7% year-to-date return: Energy (+40.3%) and Information Technology (+28.4%). Consumer Discretionary, Financials, and Utilities are all negative this year.
- Rates and oil drove third quarter performance: Energy (+17.2%) and Technology (+7.2%) led the quarter. Rate-sensitive sectors lagged as the 10-year yield rose to 5.29%, with Utilities (-12.4%), Industrials (-9.7%), and Real Estate (-5.6%) the weakest.
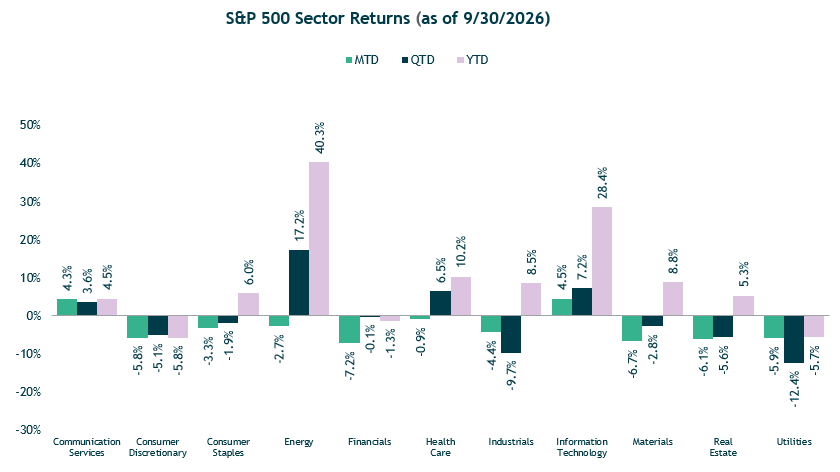
Source: Morningstar Direct. Data as of 9/30/2026.
Rates move higher in the quarter
- The Fed’s September 16th move put the funds rate at 3.75%-4%, still roughly 150 bps below the 2023-24 peak. Treasury yields have moved much further than policy, with the 2-year near 4.9% and the 10-year near 5.3%.
- The market is ahead of the Fed. The 2-year yield sits about 100 bps above the funds rate and well above the FOMC’s 4.1% median year-end projection. Investors are pricing in more tightening than the committee has signaled.
- Yields have broken out of their post-2022 range. The 10-year is now above its 2023 peak and at its highest since 2007. That reflects more than Fed policy, with growth, deficits, and heavy AI-related debt issuance pushing up long-term yields.
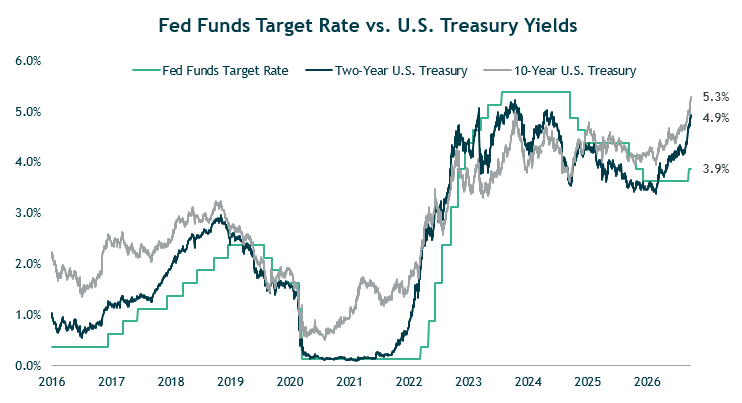
Source: Bloomberg LP. Data as of 9/30/2026.
FOMC projects on more hike before holding steady
- The Fed’s own projected rate path is higher, then flat. The median dot sits at about 4.1% for both 2026 and 2027, which implies one more hike this year and then a hold. The committee only sees easing in 2028-29, when the median drifts down to roughly 3.6%.
- Markets are pricing a much higher path. Fed funds futures sit above the dots in every year after 2026, reaching roughly 4.7% in 2027 and 5.0-5.1% by 2029. That’s about 150 bps above the committee’s median in 2029, so investors are betting the Fed will do more than it has projected.
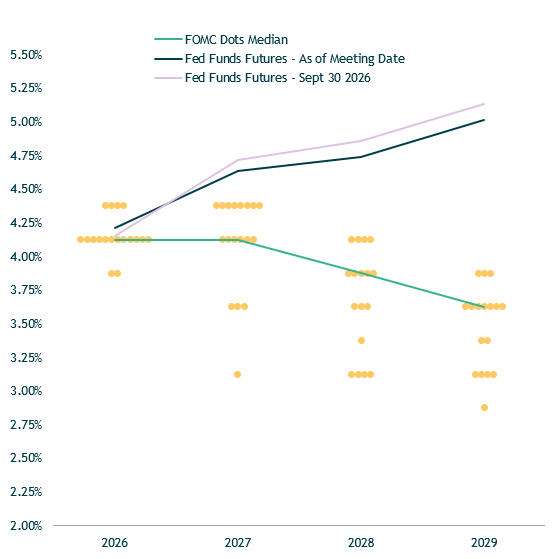
Source: Bloomberg LP, Board of Governors of the Federal Reserve System. Data as of 9/30/2026.
Above target inflation isn’t contained to just energy
- Inflation is still broad-based with about half of PCE components are still running above 3% on a 12-month basis. That’s well below the 2022 peak (~75%) but far above the 15-25% range of the 2010s, so price pressures aren’t confined to a few categories.
- Short-term momentum is cooling: The 6-month measure has dropped to roughly 42%, from about 55% earlier this year. That’s consistent with the softer July and August core PCE readings.
- Progress has stalled above pre-2020 levels as the share of components above 3% has hovered around 40-50% since 2024 rather than falling back toward the 2010s range. That supports the Fed’s view that the inflation fight is unfinished.
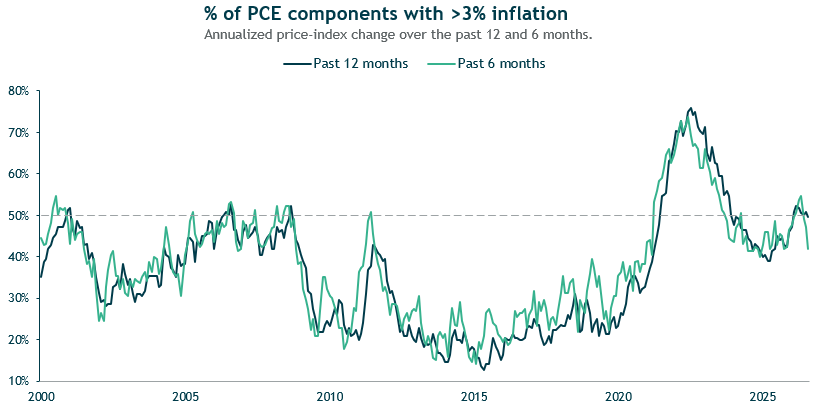
Source: Bureau of Economic Analysis. Data as of 8/31/2026.
Treasury yields on the rise
- Yields are back at pre-crisis levels: The 10-year ended the quarter at 5.29%, near its 2007 high, and the 30-year at 5.63%, a level last seen in 2002. That’s roughly 480 bps above the 10-year’s 2020 low of about 0.5%.
- The 10-year rose more than 50 bps in September alone, and the curve bear-steepened over the quarter. The 30-year is moving further above shorter maturities, so investors are demanding more compensation for duration.
- Higher yields are a return to the norm, not an outlier. The 10-year spent most of the 1990s and 2000s between 4% and 8%. The 2010-2021 period of low yields was the exception.
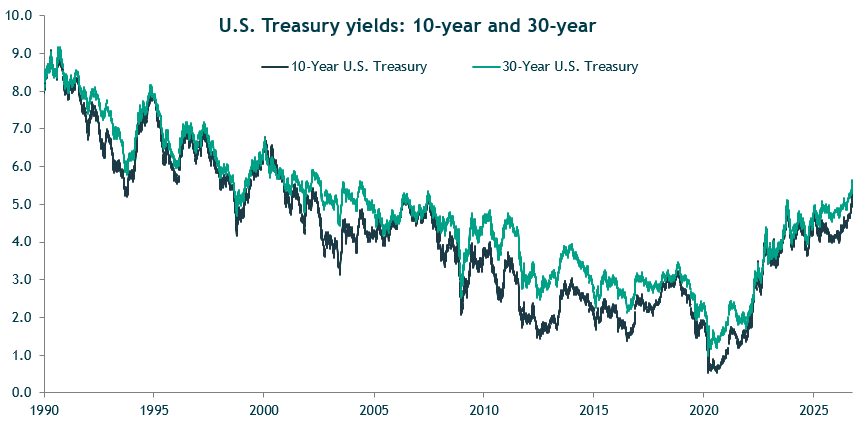
Source: Federal Reserve Economic Data (FRED), Federal Reserve Bank of St. Louis. Data as of 9/30/2026.
Hyperscalers tap the debt markets
- AI debt issuance has gone from a rounding error to a major force. AI-related debt is now above 30% of Treasury issuance so far in 2026.
- The Treasury has competition for buyers: The government is running a deficit of about $2 trillion (over 6% of GDP) while hyperscalers issue record debt to fund the AI buildout.
- Supply is pushing yields up at the long end. More bonds chasing a limited pool of buyers forces the yield needed to clear the market higher.
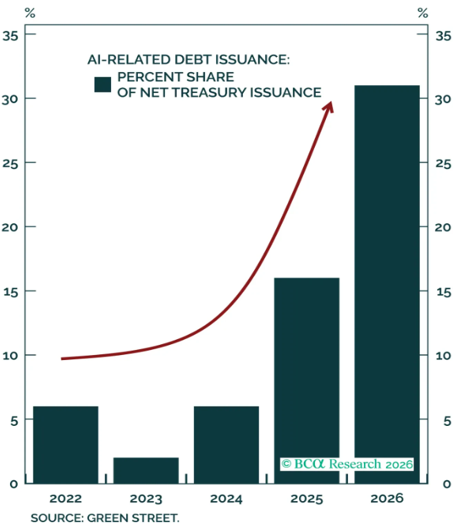
Source: BCA Research and Green Street.
Despite multiple corrections, tech sector remains silent
- Tech has already had two corrections in 2026—both fully recovered. Technology fell about 18% in March and about 14% in July, and each time it climbed back to its prior high within a few months.
- The rebound was sharp following the late-July low. The tech sector is up 16.2% from recent lows. The sector ended the quarter at a new high and is up 28.4% year to date, behind only the energy sector.
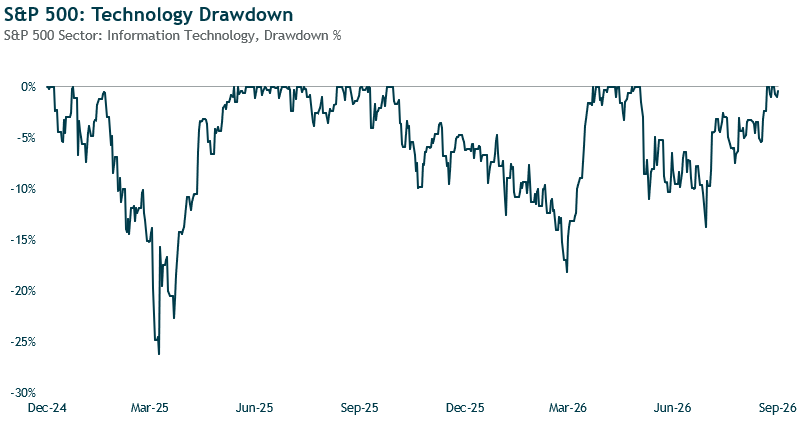
Source: Morningstar Direct. Data as of 9/30/2026.
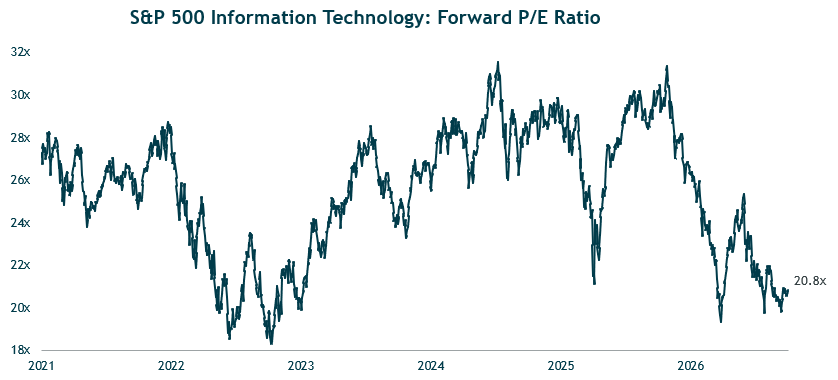
Exceptional earnings has lowered tech valuations
- Tech’s multiple has compressed even as prices rallied. The forward P/E is 20.8x, down from over 30x about a year ago.
- Earnings growth, not multiple expansion, is doing the work. S&P 500 third quarter earnings are expected to grow about 29% year over year, a third straight quarter above 25%. Tech earnings are expected to grow about 65%, per FactSet data.
- Valuation looks now reasonable against recent history. The multiple is below its five-year average even with the group at the center of the AI trade. The market is paying less per dollar of earnings than it was a year ago thanks to stellar earnings growth.
Source: Bloomberg LP. Data as of 9/30/2026.
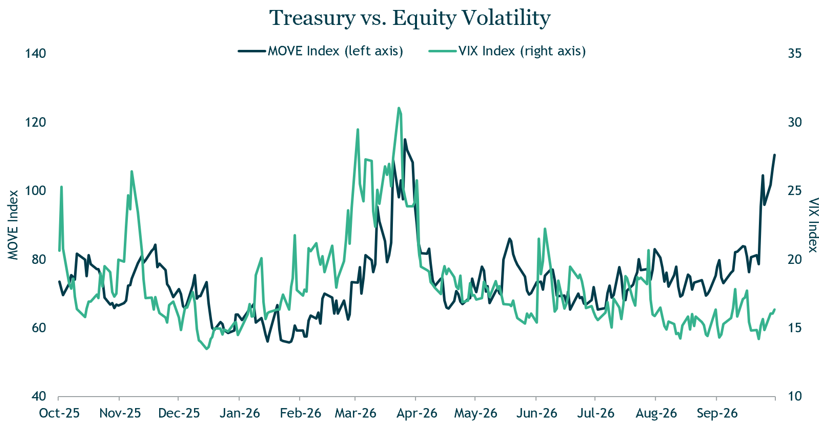
Bond and equity markets not reading the same playbook
- Bond volatility has surged while equity volatility has stayed calm. The MOVE Index jumped to about 110, close to its March peak of 115, as the 10-year yield rose more than half a point in September. The VIX stayed near 16, roughly half its March high.
- The two markets are focused on different things. Bond investors are pricing a hawkish Fed and record Treasury and AI-related debt supply. Equity investors are looking at 29% expected Q3 earnings growth and tech’s rebound. Either rates volatility settles down or the VIX catches up—the gap is unlikely to persist.
Source: Bloomberg LP. Data as of 9/30/2026.